What is Elliott Wave Theory?
Elliott Wave Theory is a technical analysis method developed based on human nature and market sentiment. It was first proposed by economic philosopher Ralph Nelson Elliott in 1938 in his work 'The Wave Principle'.
Elliott observed that price fluctuations in financial markets are not completely random but exhibit a wave structure that has regularity and repetitiveness. These fluctuation patterns reflect the emotional ups and downs of the market crowd, thus having a certain predictability.
According to this theory, a market price in healthy development can be divided into two types of fluctuations.
📈 Upward impulsive wave (main upward wave)
📉 Downward corrective wave (adjustment wave)
A complete wave cycle consists of five main upward waves (1-2-3-4-5) and three corrective waves (ABC), forming a total of a '5-3 wave structure'.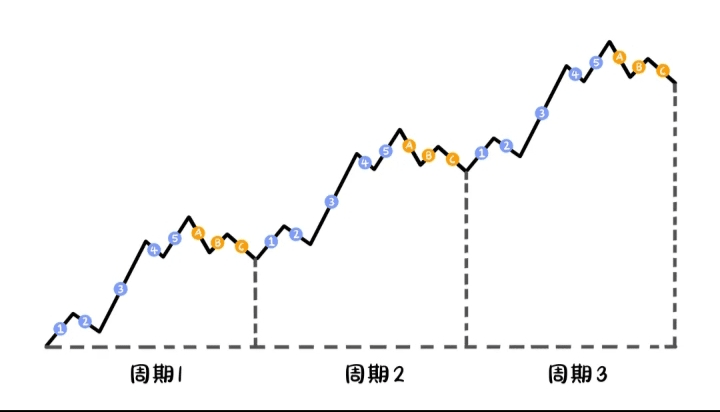
More interestingly, these wave structures will recursively progress and repeat similarly across different time periods. In other words, minor waves will form part of major waves, and the same structure can also be observed in major waves. This characteristic is known as the fractality of waves.
Upward trend waves
The upward trend wave is the fluctuation process of market prices continuing to rise in a bull (bullish) trend, usually characterized by phase increases and pullbacks. Each rise represents the market's gradually strengthening confidence in higher stock prices. The pullback is a short-term price correction, but the overall trend remains upward.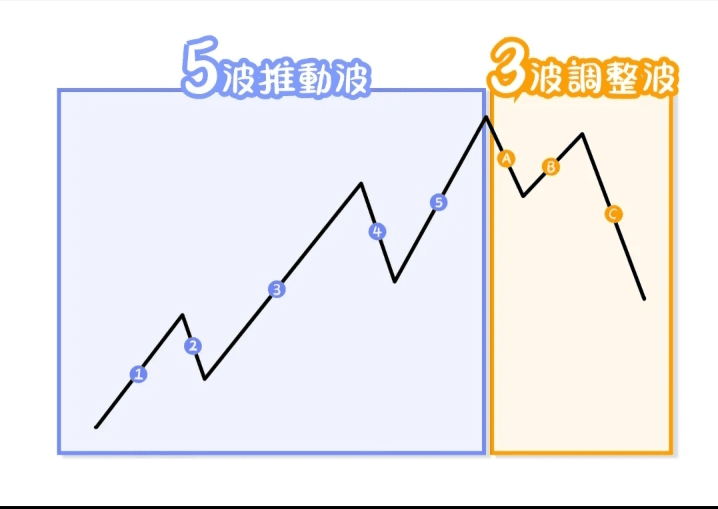
1. 5-wave impulsive wave
When stocks rise, they usually include 5 waves of upward movement and 3 waves of correction. This structure is called the '5-3 wave pattern.'
The 1, 2, 3, 4, 5 of the first five waves are called impulsive waves. Impulsive waves move along with the major trend.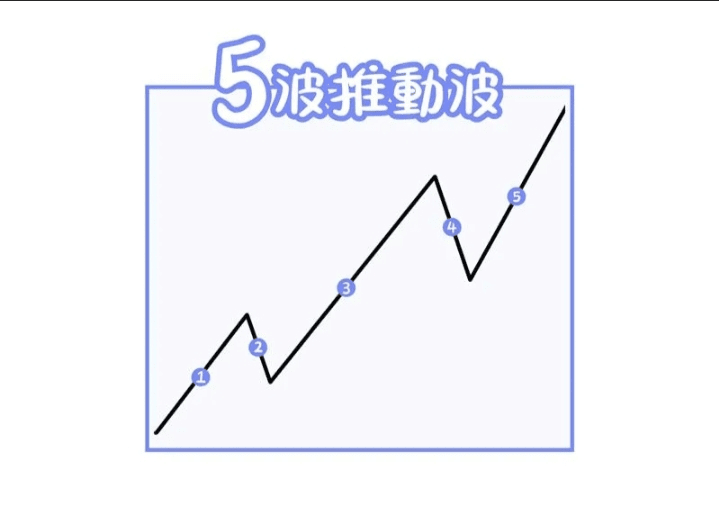
The first wave is in the initial stage, commonly seen in the market from a low point.
The second wave is the corrective wave of the initial trend.
The third wave is usually the strongest, accompanied by increased trading volume.
The fourth wave is the corrective wave of the third wave.
The fifth wave is the final push, usually still having continuation.
2. Wave 3 corrective wave
The last three waves are called A, B, and C waves, which are corrective waves, moving in the opposite direction of the major upward trend.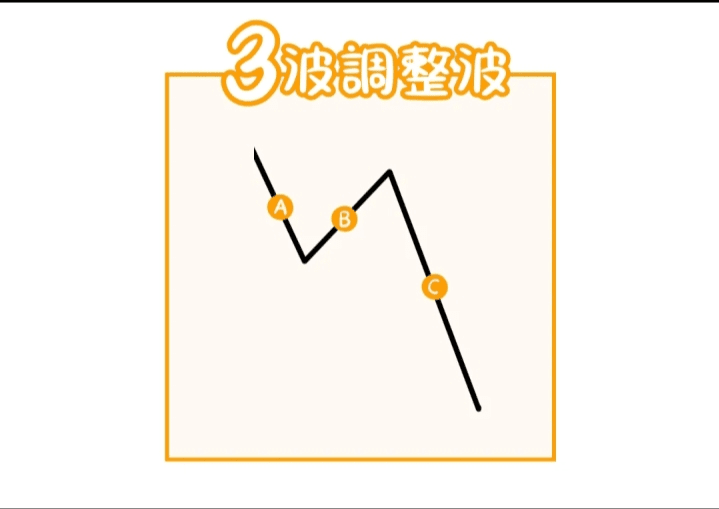
Wave A is the initial correction.
Wave B is a short-term rebound.
Wave C is the strongest retracement.
This pattern repeatedly appears at different stages of a bull market, where the price rises above the previous wave, ultimately forming an upward trend.
Rules for upward waves
A trend is formed by many waves, but some waves do not conform to Elliott Wave Theory, so we must understand the rules to avoid misjudging some non-compliant waves as Elliott waves. Next, we will learn how to determine whether an upward trend wave conforms to Elliott Wave Theory.
1. The low point of Wave 2 must not break below the starting point of Wave 1.
The retracement of Wave 2 cannot drop below the starting point, but some viewpoints believe that the retracement of Wave 2 should not exceed half of Wave 1, though this depends on the actual market trend.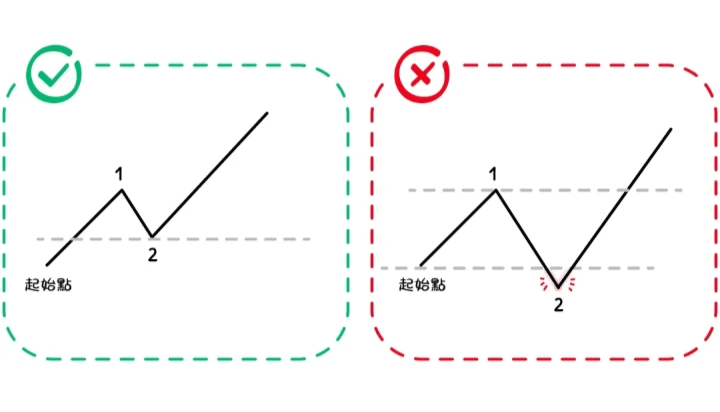
2. Wave 3 will not be the shortest wave.
Wave 3 is usually the main upward phase, as it represents the public participation stage in Dow Theory. Its increase often exceeds the high point of Wave 1. It is usually the strongest segment in the 5-wave impulsive wave.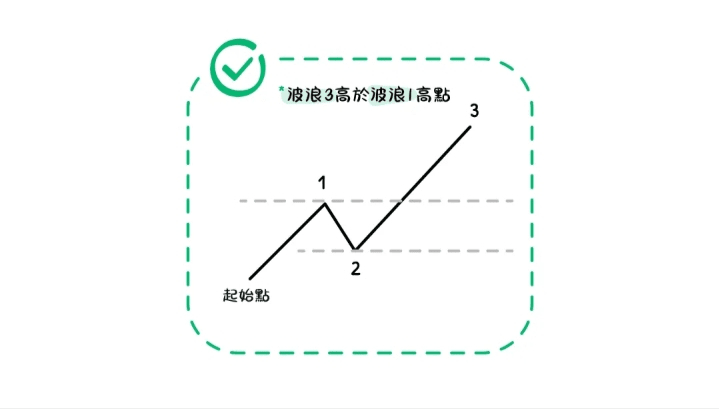
3. Wave 4 will not enter the price range of Wave 1.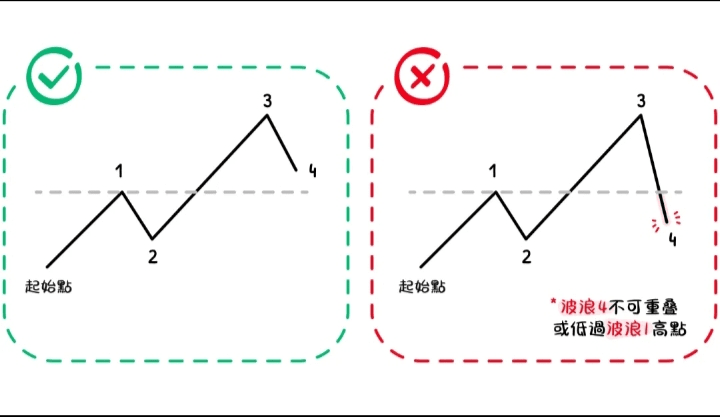
4. Wave B will not exceed the starting point of Wave A.
The high point of Wave B usually does not exceed the original high point of Wave A, indicating that the rebound amplitude within the corrective structure is limited.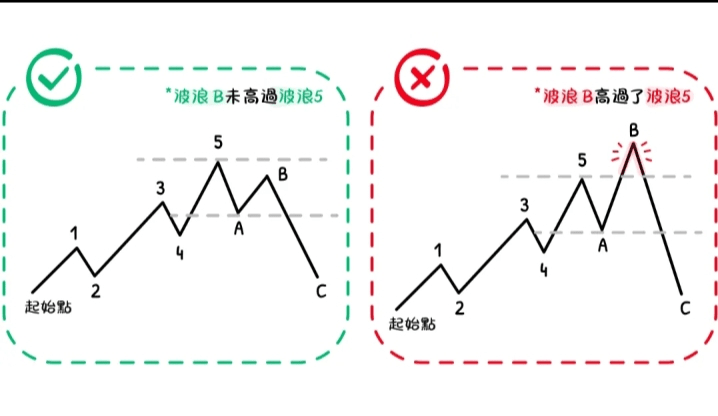
The wave characteristics and rules of the downward trend
In a bear market, the downward trend wave refers to the price decline process in a bearish trend, usually characterized by phase declines and rebounds. Each price decline reflects changes in market sentiment, while the rebounds are short-term corrections, but the overall trend remains downward.
However, in such a market, wave theory also has its fixed patterns. Firstly, the first five waves are the downward impulsive waves, with the overall trend heading downwards, while the last three waves are the opposite rebound waves. Although there is a short-term increase, the overall trend still maintains a downward trajectory.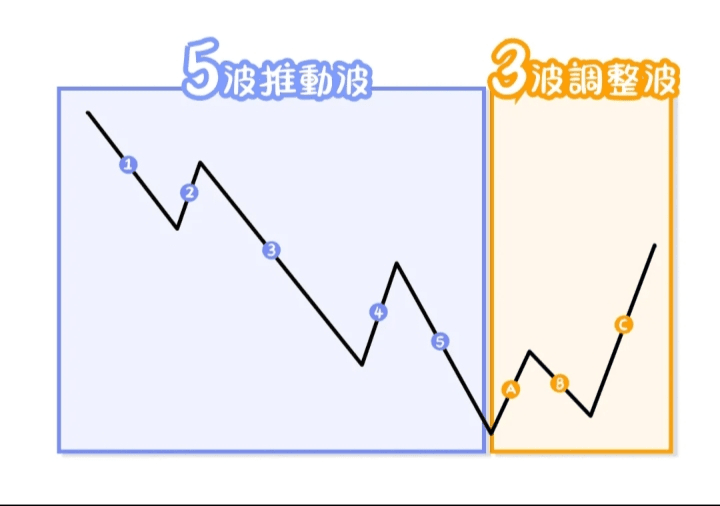
The first wave is the end of the price high, commonly seen at the peak of a bull market.
The second wave is a corrective wave, opposite to the downward trend.
The third wave continues the direction of the major trend and is the strongest wave, usually accompanied by increased trading volume.
The fourth wave is the corrective wave of the third wave.
The fifth wave continues the final push, usually with continuation.
The last three waves are also called A, B, and C waves, with movements opposite to the major trend.
Wave A is a short-term rebound.
Wave B is a corrective wave.
Wave C is the strongest rebound, but the overall trend does not change.
This pattern often starts at the peak of a bull market and also indicates the beginning of a price drop.
How to calculate wave retracement?
In Elliott Wave Theory, wave retracement is often calculated based on the Fibonacci sequence, especially during the corrective wave (Corrective Waves) phase. As for entry points, one can choose to wait for price retracements after the establishment of the impulsive wave and judge the retracement amplitude based on the Fibonacci sequence.
Wave 1
The first impulsive wave is mainly used to calculate the standards for other different wave lengths.
Wave 2
The retracement range usually does not drop below Wave 1, while the retracement range will be between 38.2% to 76.4%.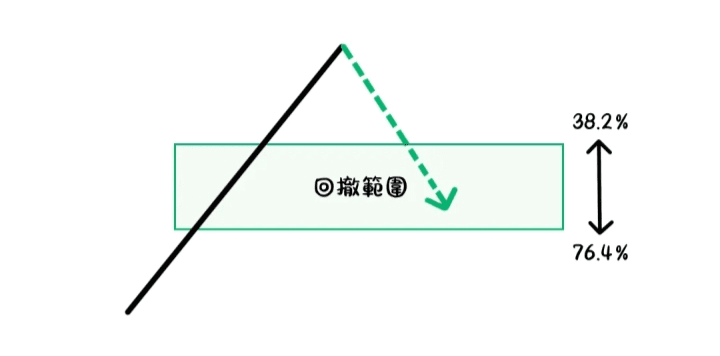
Wave 3
Determined based on the length of Wave 1 and also applying Fibonacci extension calculations.
This is beneficial for us to arbitrage based on the length of the extension. The further the extension distance, the greater the potential profit; conversely, the closer the distance, the relatively smaller profit. For example, short-term traders can set targets TP1, TP2, and TP3 based on the extension ratios of 1.618, 2.618, and 4.236, and then exit in batches.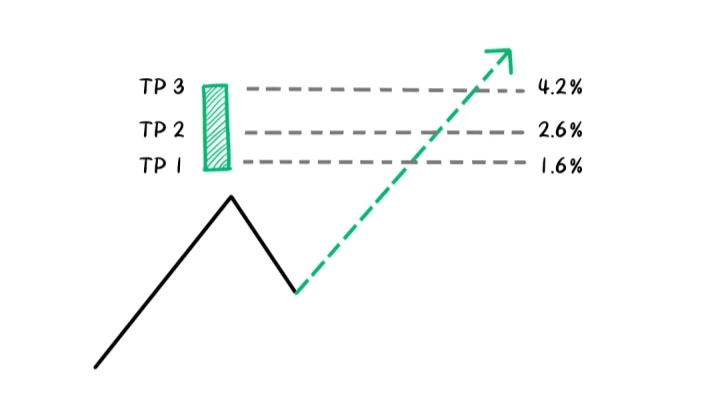
The length of Wave 3 is usually a multiple of the length of Wave 1.
Wave 4:
In contrast to Wave 3, belonging to the corrective wave, the retracement of Wave 4 is usually between 23.6% to 50% of Wave 3, and in rare cases, it may reach 61.8%.
Wave 5:
The goal of Wave 5 is to surpass the endpoint of Wave 3, creating new highs (upward trend) or lows (downward trend). The momentum of Wave 5 is usually lower than that of Wave 3, and trading volume may also decrease, indicating that the market trend is approaching its end.
Backtesting waves:
Wave A: The first wave of correction, representing the first segment of reversal from the impulsive wave. Its direction is opposite to the major trend.
Wave B: A rebound or reversal wave within the corrective wave, usually retracing 38.2% to 78.6% of Wave A, its direction is opposite to Wave A but consistent with the major trend, with relatively weak momentum.
Wave C: The ending wave of the corrective wave, continuing the direction of Wave A, usually surpassing the endpoint of Wave A, structurally consisting of a complete impulsive wave made up of 5 sub-waves, with lengths often being 1.382 or 1.618 times that of Wave A.
Elliott Wave Theory - Extended Waves
In wave theory, Wave 3 is typically the strongest segment of the impulsive wave, and it may consist of smaller waves, namely the sub-wave structure of Waves 1 to 5.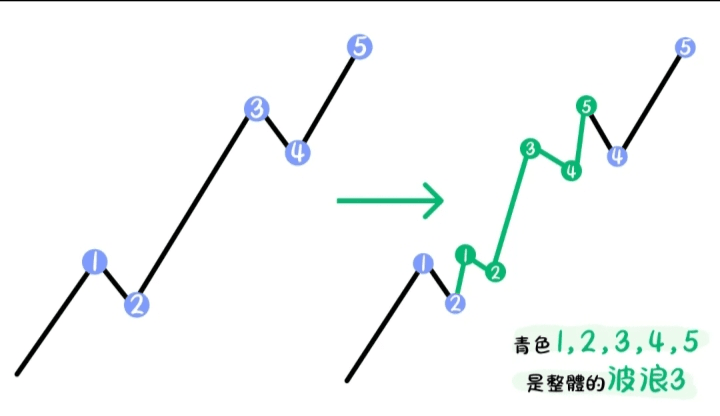
This means that Wave 3 may further decompose into five smaller impulsive waves, forming a larger upward wave. The following will use Wave 3 as an example.
1. Actual case of XRP daily chart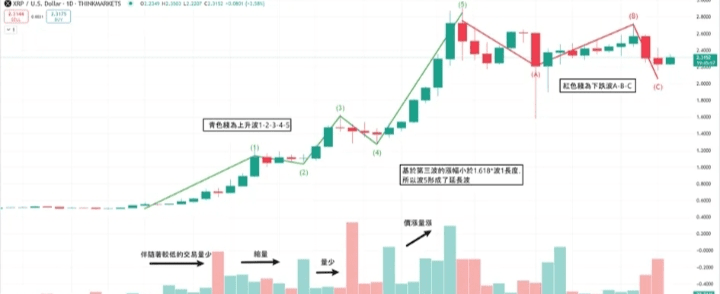
From the XRP daily chart, we can see that the market trend follows the typical structure of Elliott Wave Theory, showing a complete five-wave impulsive wave (green segments indicate 1-2-3-4-5) and the subsequent three-wave corrective wave (red segments indicate ABC).
The following is wave analysis and interpretation based on the chart:
Wave 1: The initial upward market starts from the bottom, forming the first upward wave. This phase is usually accompanied by lower trading volume, indicating that the market is initially forming a bullish trend.
Wave 2: After the end of Wave 1, a price pullback occurs, but the retracement amplitude is limited, and the retracement amplitude will not fall below the starting point.
Wave 3: Strong upward movement. Usually, Wave 3 is the longest and strongest in the impulsive wave, but here, it can be seen that the increase of Wave 3 is small, with no signs of extension. This will affect the strength of Wave 5, possibly leading to its extension, and the pace of price increase is more intense.
Wave 4: The consolidation wave Wave 4 is characterized by a sideways movement or a small amplitude pullback, similar to the pullback amplitude of Wave 2.
Wave 5: The ultimate upward wave 5 further pushes prices to innovate new highs while breaking through the high point of Wave 3. However, due to the weaker momentum of Wave 3, Wave 5 extends, and trading volume increases.
Wave A: The initial downward wave A is the first corrective wave, with the price starting to drop from the high point of Wave 5. This usually reflects some investors taking profits, leading to a short-term market pullback.
Wave B: The rebound corrective wave Wave B is a rebound against Wave A, and the price fails to re-touch the high point of Wave 5, with trading volume usually low during this phase.
Wave C: Continuing the downward wave C is the last wave of the corrective wave, with prices further declining and breaking through the low point of Wave A.
2. Actual case of XRP 4H intraday chart (continuing from the previous example)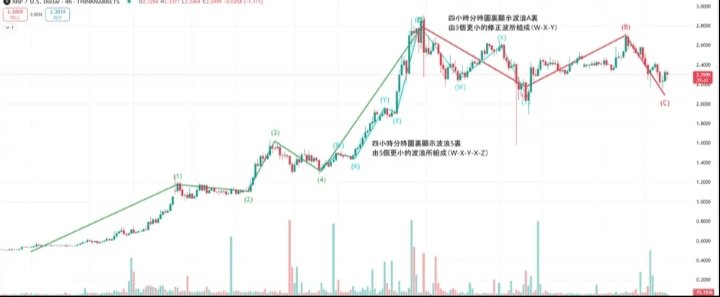
Following the above chart, if switched to a 4-hour intraday chart, the structure of Wave 5 shows more detailed fluctuation characteristics. According to Elliott Wave Theory, Wave 5 is usually the last segment of the major trend's impulsive wave, composed of five smaller minor waves, namely WXYXZ.
By carefully observing the intraday chart, we can see that each minor wave has its unique shape and structure. Usually, Wave Y is the strongest and most forceful among these five minor waves, but here, Wave Y has not extended.
Wave X2 presents a more moderate pullback, with the final Wave Z extending while reaching a new high to conclude.
After Wave Z ends, the market usually enters a corrective phase, forming a typical ABC corrective wave. This corrective wave segment describes the market's pullback structure after the end of the major trend.
First is Wave W, which is the first wave of correction, usually opposite to the previous main trend, exhibiting characteristics of rapid pullbacks. At this stage, most investors believe it is just a short-term correction, so trading volume may be low.
Next is Wave X, which is the price's rebound wave towards the main trend direction, but the rebound strength is often weaker than Wave W, usually reflecting the market's hesitation and uncertainty regarding trend changes. During this phase, the price may show false breakouts, and trading volume is low.
Finally, Wave Y is the last wave of correction, with the price breaking through the endpoint of Wave W.
Finally, the identification of waves has a certain subjectivity; market fluctuations do not always strictly follow the predetermined wave structure.