
Is it time to ride before the doors close?
With increasing momentum on low-value coins, the SAHARA/USDT coin has emerged as one of the prominent names witnessing growing interest from traders in recent hours.
In this article, we present you with a professional analysis highlighting what is happening at this moment and what could happen later.
---
🔍 Quick Overview:
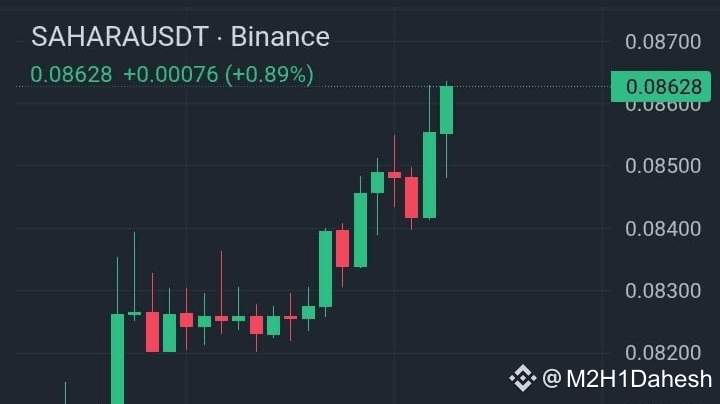
Current Price: 0.0862 USDT
Change Percentage (24 Hours): +3.37%
Highest Price of the Day: 0.08629
Lowest Price of the Day: 0.07881
Trading Volume (SAHARA): 334.99 Million
Analysis Time Frame: 15 Minutes
---
📊 Technical Analysis of SAHARA Coin
🔹 General Trend:
It is evident from the chart that the coin has entered a strong upward trajectory starting from a low near 0.0788, achieving a series of rising peaks and troughs, confirming the establishment of a short-term upward wave.
The recent candles show clear buying strength, especially after breaking the 0.0855 level, which is an important minor resistance level, reflecting the current dominance of buyers.
---
🔹 Momentum and Volume:
The upward momentum is accompanied by high trading volumes, which is a good sign that this rise is effectively supported.
The Momentum Indicator and RSI on the short-term frame indicate approaching the overbought area, but strong reversal signals have not yet appeared.
---
🔹 Support and Resistance Levels:
First Support: Located at 0.0840 and is a strong dynamic support tested at least twice, representing a potential rebound zone in case of a correction.
Second Support: At 0.0815, which is the starting point of the previous momentum, and breaking it may indicate weakness in the upward trend.
Current Resistance: Ranges between 0.0868 and 0.0870, considered a critical ceiling that must be closely monitored, as breaking it may confirm the completion of the upward wave.
Next Resistance: At 0.0900, a psychological and technical target that attracts traders' attention, and may be followed by a rapid surge if broken with a clear close.
---
📈 Trading Scenarios
📌 Positive Scenario:
If liquidity continues to flow in and the 0.0870$ area is broken with a strong candle close, we may witness a continuation of the trend towards 0.090$ then 0.094$ in the short term.
⚠️ Negative Scenario:
If the breakout fails and reversal candles appear or a sudden drop in trading volume occurs, prices may return to test the 0.0840 support, and it is preferable to wait at that time.
---
🧠 Recommendations and Conclusion:
🔸 The SAHARA coin shows promising positive signals, but it is still in the early stage of breakout.
🔸 Smart entry is after confirming the breakout with strong trading volumes.
🔸 The smart trader balances opportunities and risks, and uses stop loss in every trade.
🚨 Important Reminder: This analysis is not an investment recommendation, but a technical vision aimed at clarifying overall trends. Always conduct your own research before making any decision.
---
📢 Are you monitoring SAHARA? Share your predictions with us in the comments below 👇
Stay tuned for more accurate analyses of upcoming market opportunities 🔍