📊 Explanation of indicators on the chart
🔵 First: Bollinger Bands
What is it?
A tool for measuring market volatility.
Consists of 3 lines: 1️⃣ Upper line (UP): the upper limit of volatility. 2️⃣ Middle line (MB): the simple moving average (SMA) for a certain period. 3️⃣ Lower line (DN): the lower limit of volatility.
Period = 20 candles.
Standard deviation = 2.
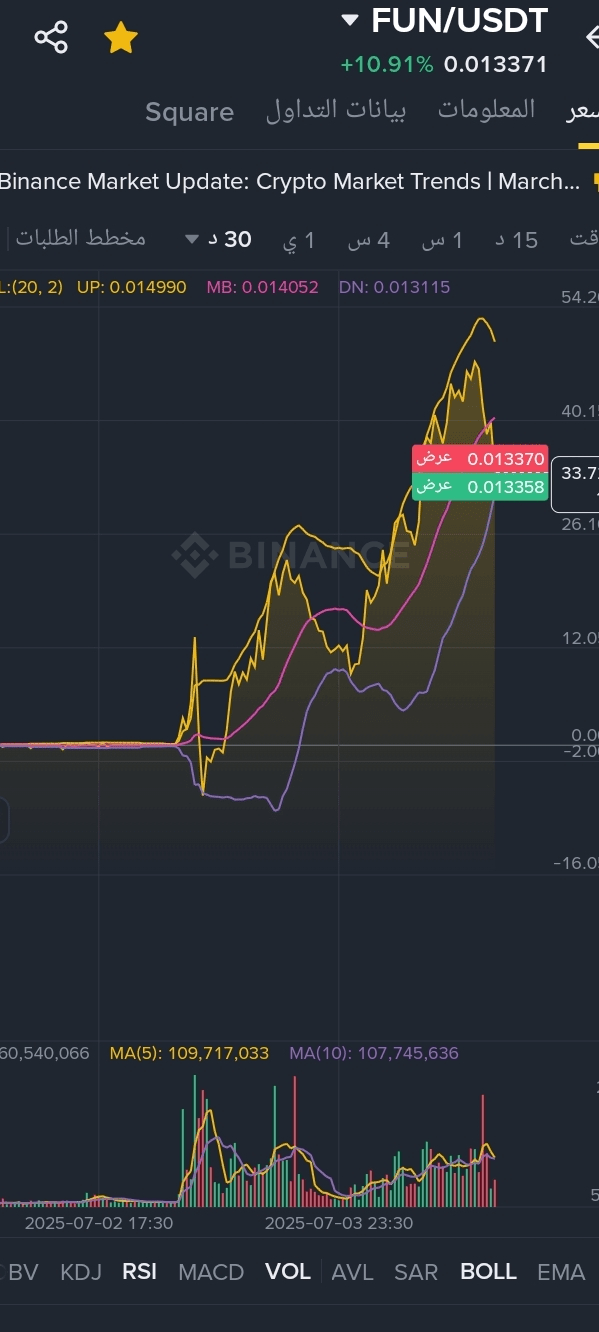
Values:
UP = 0.014990
MB = 0.014052
DN = 0.013115
How to read it? ✅ When the price is near the upper line:
The market is in strong buy condition.
Possible overbought signal.
Sometimes after this, a downward correction occurs. ✅ If near the lower line:
The market is in strong sell condition.
Possible buying opportunity. ✅ If in the middle:
The market is stable or in a state of balance.
Your current state:
The price is very close to the upper line.
High probability of strong buying pressure, but beware of a downward correction.
🟣 Second: Moving Averages MA
What is it?
An indicator that shows the overall trend of the price by calculating the average closing price over a specific period.
MA(5): Average of 5 candles.
MA(10): Average of 10 candles.
In the image:
MA(5) = 109,717,033 (yellow color)
MA(10) = 107,745,636 (purple color)
How to read it? ✅ If MA(5) is above MA(10):
Short-term bullish trend. ✅ If MA(5) is below MA(10):
Short-term bearish trend. ✅ Large divergence between them:
Strong momentum (up or down). ✅ MA(5) crossing MA(10):
Signal of trend change.
MA(5) is slightly above MA(10).
Boosts the bullish signal.
🟢 Third: Trading volume (Volume)
What is it?
Measures the trading volume for each time period.
The colored candles below the chart represent the trading volume.
How to read it? ✅ If the price rises with increasing volume:
Strong confirmation of the trend. ✅ If the price rises with decreasing volume:
Weak movement and may reverse. ✅ Sudden large volumes:
Entry of large investors or strong news.
Your current state:
There are clear peaks in trading volume.
Indicates that the upward movement is supported by strong momentum.
🟡 Fourth: Rate of change
+10.91% in a short period.
Considered a relatively large rise.
Make sure to follow the price movement if you are thinking of entering.
🔍 Quick interpretation of what you see:
The price is now in a strong upward wave.
Moving near the upper limit of the Bollinger Band.
Trading volume is large.
Short moving averages confirm the bullish trend.
It may be followed by profit-taking and a short-term downward correction.
⚠️ Important trading tips:
1. Do not enter the trade immediately after a big rise without confirmation.
2. Watch for any price correction to strong support points.
3. Use a Stop Loss to avoid risks.
4. Make sure to follow the news affecting the currency.