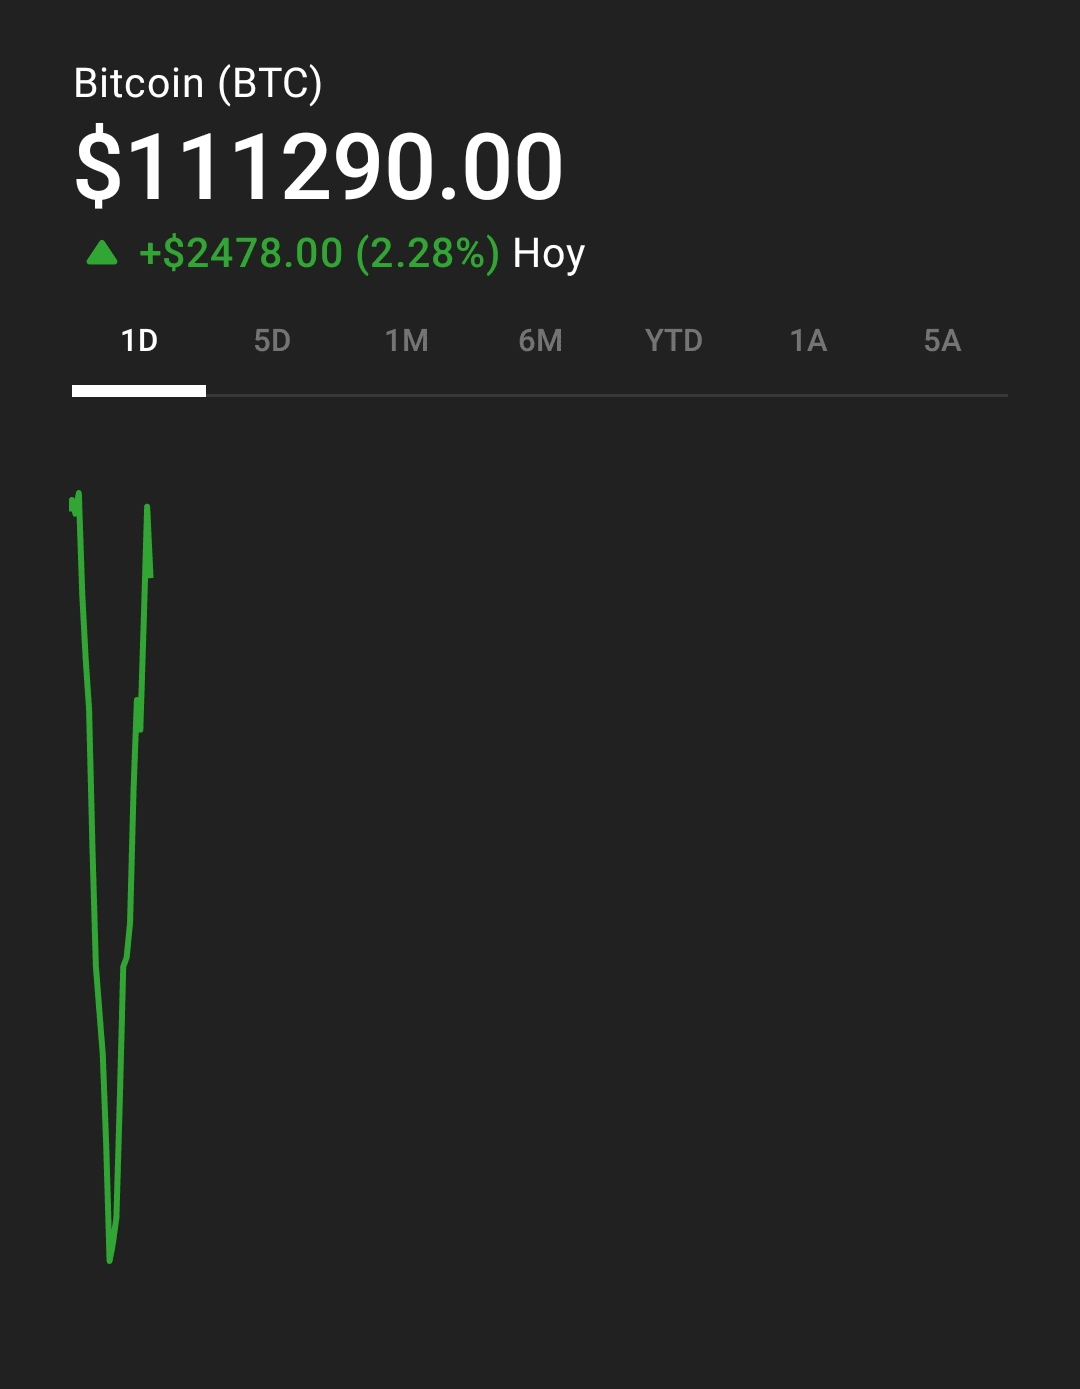
Bitcoin has broken to new all-time highs, trading near 111,300 USD and surpassing the previous peak of ~112,000 USD. After a consolidation around 108,000–110,000 USD, the price shows bullish strength.
---
📊 Technical Analysis
Moving Averages: BTC is above the SMA-7 (108,940 USD), SMA-20 (106,950 USD), SMA-50 (106,725 USD), and SMA-200 (~96,600 USD), a clear signal of an upward trend.
RSI & Momentum: RSI 14 ≈ 60–61, in bullish territory but still far from overbought. MACD and stochastics reflect strong momentum, although stochastic %K (~98) is overbought, suggesting caution.
Supports/Resistances:
Main support: ~108,000 USD, coinciding with the convergence of EMA20 and SMA50.
Key resistance: ~111,990 USD–112,000 USD. A solid close above could drive a rise of +5–10%, while a rebound from resistance could trigger a correction towards 102,000 USD.
---
👥 Traders and opinions
Brian Shannon (AlphaTrends): expert in 'trend trading and multi-timeframe', always recommends having a plan B before entering each trade.
Anne-Marie Baiynd: authority on breakout and momentum, her MPS system is widely used by traders who follow.
breakouts in short timeframes. 💡 Conclusion and strategy
The trend is officially bullish, with multiple technical signals confirming continuity.
Recommended strategy:
1. Breakout: Entry after daily close above ~112,000 USD.
2. Pullback: Looking to enter near 108,000 USD with a stop below 107,500 USD.
Manage risk well: stop-loss below support and partial targets at +5% to +10%.
---
To summarize: the momentum is positive, but the market is in overbought territory. Monitoring near 112,000 USD will be key.