Based on the image you've provided from Binance showing the BTC/USDT (Bitcoin to USDT) 1-hour chart analysis, here's a comprehensive essay analyzing the technical indicators, market movement, and overall sentiment:
Essay: Bitcoin Technical Analysis and Market Momentum – A Bullish Surge Toward $117K
The Bitco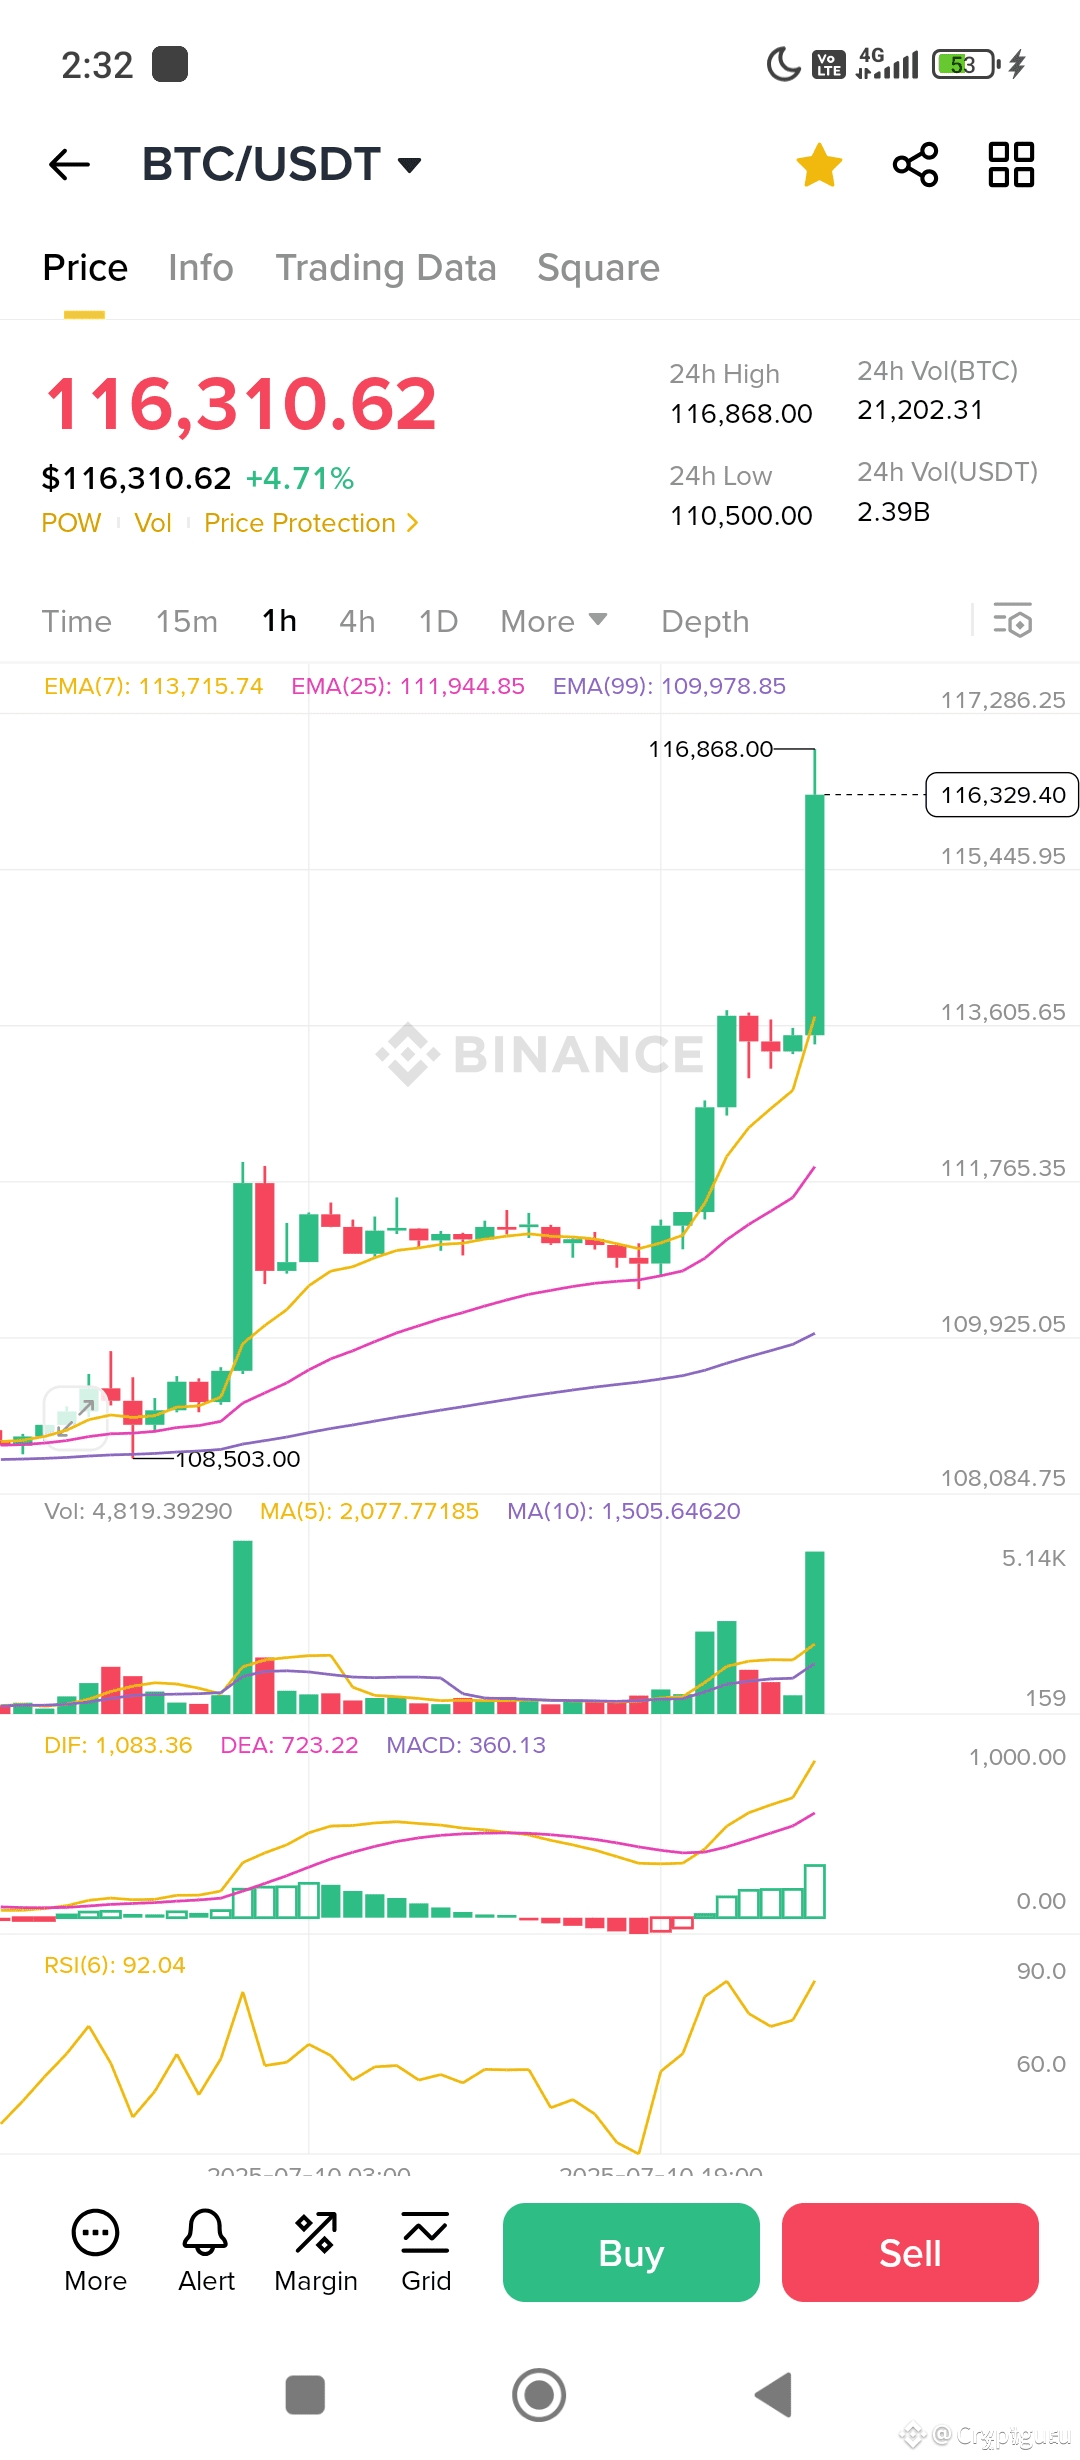 in (BTC) to USDT pair has demonstrated a strong bullish breakout, with the price currently sitting at $116,310.62, reflecting a +4.71% gain within 24 hours. This momentum is supported by significant trading volume and technical indicators aligning in a bullish direction, suggesting high investor confidence and potential continuation of the trend.
Price Action and Market Momentum
The price chart reveals a rapid upward movement with a large green candle breaking through previous resistance levels. Bitcoin has reached a 24-hour high of $116,868, significantly higher than the 24-hour low of $110,500, showcasing a strong upward trend. The sharp vertical movement accompanied by a spike in volume indicates a likely institutional or whale-driven surge.
Moving Averages (EMA Analysis)
Three major EMAs provide strong confirmation of bullish sentiment:
EMA(7): $113,715.74
EMA(25): $111,944.85
EMA(99): $109,978.85
The short-term EMA(7) is well above the medium and long-term EMAs, creating a perfect alignment for bullish momentum. This crossover pattern, often referred to as a “golden alignment,” is a positive signal for short-term traders and swing investors alike.
MACD Indicator (Moving Average Convergence Divergence)
The MACD data below the main chart shows a wide gap between the DIF (1,083.36) and the DEA (723.22) lines, with the MACD histogram at 360.13. This sharp divergence is a powerful bullish signal, confirming strong momentum and buying pressure. The green bars on the histogram are growing larger, further indicating an increasing upward momentum.
RSI Indicator (Relative Strength Index)
The RSI value of 92.04 indicates that Bitcoin is in a highly overbought zone. While this suggests extreme bullish momentum, it also raises caution for a potential short-term pullback or correction, as the RSI rarely remains at such elevated levels for extended periods.
Volume Analysis
The trading volume has spiked significantly, with a 24-hour BTC volume of 21,202.31 BTC and USDT volume at 2.39B, validating the price movement with strong trader participation. The volume candle beneath the price chart shows a massive green bar aligning with the breakout, suggesting that the surge is backed by real market interest rather than speculation.
Conclusion:
This technical analysis of BTC/USDT points to a strong bullish breakout, driven by volume, EMA alignment, and positive MACD divergence. However, the RSI exceeding 90 indicates that Bitcoin is heavily overbought in the short term. While there may be further upside potential in the immediate future, traders should remain cautious of a possible pullback or consolidation phase.
In summary, Bitcoin’s price action is bullish, with momentum potentially targeting levels beyond $117,000, but disciplined risk management is crucial in such volatile conditions.