Japanese candlesticks are among the most important tools for technical analysis in the cryptocurrency market, providing a clear visual representation of price movement and used to identify points of reversal or trend continuation.
Here are the most famous candlestick patterns and how to read them:
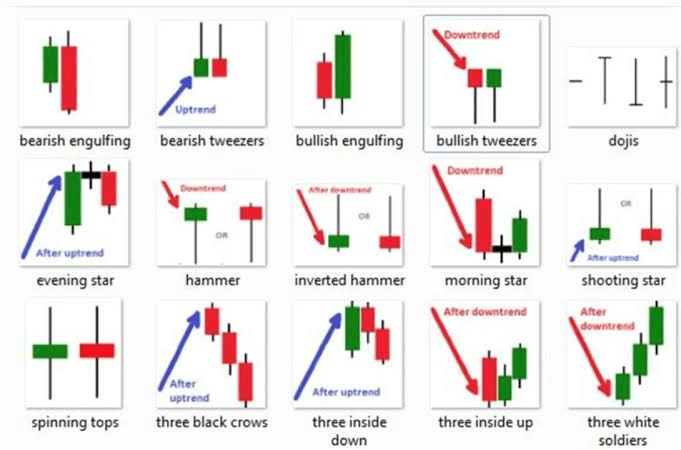
🔻 First: Bearish Reversal Patterns (after an increase)
1. Bearish Engulfing - Bearish Engulfing
A large red candle closes below the previous green candle and completely engulfs it, indicating a strong shift in direction towards a decline.
2. Evening Star - Evening Star
Appears after an upward trend and consists of three candles: long green, then a small candle, then a strong red candle → A clear reversal signal.
3. Shooting Star - Shooting Star
A candle with a small body and a long upper shadow, indicating rejection of the price continuing to rise.
4. Three Black Crows - Three Black Crows
Three consecutive long red candles indicate increasing selling pressure.
-
🔼 Secondly: Bullish Reversal Patterns (after a decline)
1. Bullish Engulfing - Bullish Engulfing
A large green candle engulfs the previous red candle, indicating strong buyer entry.
2. Morning Star - Morning Star
A triple pattern that appears after a downward trend: a red candle, then a small candle, then a strong green candle → An indicator of a bullish reversal.
3. Hammer - Hammer
A candle with a small body and a long lower shadow, indicating a potential bullish reversal if it comes after a decline.
4. Three White Soldiers - Three White Soldiers
Three consecutive green candles with strong bodies indicate the beginning of a strong upward trend.
⚖️ Thirdly: Indecision Patterns
1. Doji - Doji
A candle with a very small body and a long tail, indicating market indecision and may precede a reversal.
2. Spinning Tops - Spinning Tops
Small body with upper and lower shadows → A struggle between the seller and the buyer, often appearing during periods of volatility.
💡 Advice for beginners:
Do not rely solely on the candlestick pattern; instead, combine patterns with indicators (such as RSI or support and resistance areas) to confirm the signal, and practice on a demo account before investing real capital.
Do you trade with these patterns? Share your experience in the comments 👇