If you don't trade by looking at volume, you are shooting arrows in the dark! 📉📈

What is Volume?
Volume means — how many times a coin is being bought and sold in a specific time. This indicator helps you understand:
✅ How much buying-selling pressure is in the market
✅ Is a price trend real or fake
✅ Will the breakout last or is it just hype?

Example:
🟢 If the price of Bitcoin is increasing + volume is also increasing = (This is a strong uptrend signal.)
🔴 Price is increasing, but volume is decreasing = (Be cautious! This could be a fake move!)
📊 How to understand?
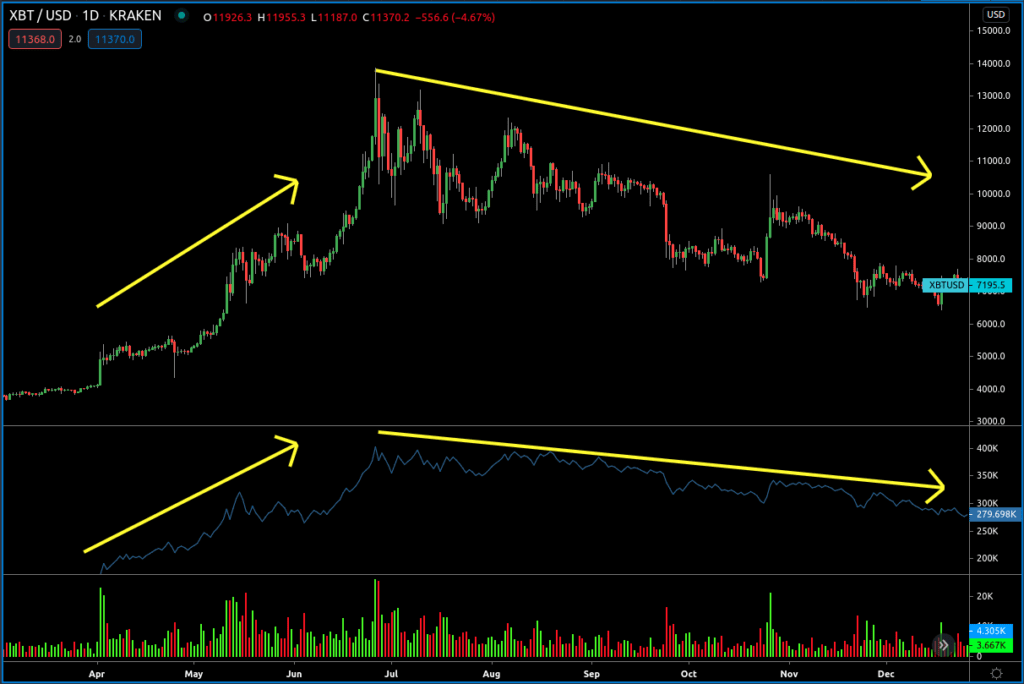
The large bars you see at the bottom of TradingView or Binance charts (red-green) — those are the volume.
Green bar = Buy pressure
Red bar = Sell pressure
⚙️ Important Volume Indicators:
OBV (On Balance Volume) → Indicates market pressure by adding and subtracting volume from price.
VWAP → Shows what the price should be according to volume.
MFI/CMF → Shows whether money is entering or exiting the market.
🎯 Why is Volume so important?
Without volume, just looking at the price won't help you understand whether this price is real.
An increase in volume means new traders are entering the market — this could be your buy/sell time.

🔚 Final word:
👉 Trade by looking at both price and volume.
👉 This way you will avoid false breakouts or fake signals.
👉 Understanding volume allows you to make decisions like professional traders.
📌 Conclusion:
Volume is an indicator of the strength of price momentum.
Analyzing price & volume together makes trading more accurate.
✅ Price up + volume up = strong bull momentum
⚠️ Price up + volume down = potential reversal
#VolumeAnalysis #BinanceBangla #BinanceVolume