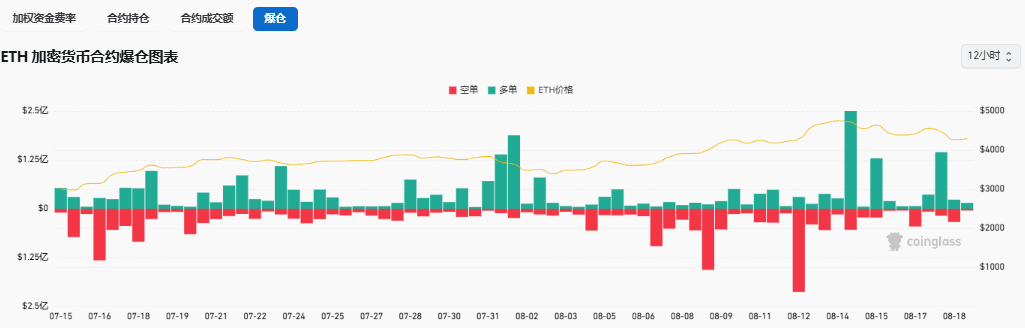
This image conveys two core points that are closely related to our retail investors' wallets:
ETH Contract Liquidation Amount (Green Bar): Do you see that green bar reaching 5.25 billion dollars (peak) in the chart? That's the total amount of forced liquidations in Ethereum contract trading from mid-July to mid-August (mainly due to leverages gone wrong leading to forced liquidations by platforms). Recently, this bar has shrunk quite a bit, dropping below 5.125 billion dollars. What does this indicate? It means that recent liquidations haven't been as severe, but the absolute value is still frighteningly high! Market fluctuations may have eased somewhat, or gamblers have temporarily pulled back/been burned?
ETH Price (Yellow Line): Looking at that yellow line that plunged from $5000 all the way down to the $1000 range, your heart must be bleeding, right? This is the actual price trend of ETH during the same period, and the drop was devastating, a classic 'ankle chop'.
Block Key Perspectives & Blood and Tears Cases:
Perspective One: Liquidation amount is the 'blood pressure monitor' of market sentiment! During the price crash, the liquidation peak of 5.25 billion dollars was when the market was most panicked, leverage was crowded, and the battle between bulls and bears was most brutal (think of that sharp drop in July). Now that the liquidation amount has come down a bit, it doesn't mean it's safe; it might just be that 'bodies' have been cleared or that everyone is temporarily afraid to use high leverage.
Perspective Two: Prices have plummeted, yet the liquidation amount remains high? Dangerous signal! The coin price has dropped from 5000 to just over 1000 (a decline of over 80%), but you see the recent low of the liquidation amount still hovering above 5.1 billion (only about a 4% decrease from the peak of 5.25 billion). This is very abnormal! It indicates that even though prices have dropped this much, the 'gambling nature' of the contract market is still very strong, with a lot of capital still battling and leveraging. This is a classic case of 'licking blood on the knife's edge'; with even a slight reverse fluctuation, it could lead to a bloodbath! Think of those brothers who kept trying to bottom out at 3000, 2000, or even 1500 and ended up getting liquidated multiple times... there are plenty of cases, and aren't there posts crying out for help in communities and on Weibo?
Perspective Three: 'Easy liquidation' (suspected 'closing positions' or 'transferring positions') hints at undercurrents! The mention of 'easy liquidation' in the chart, combined with the 'contract positions' and 'transaction volume' menus, suggests frequent closing or transferring of positions. This often implies that large funds or smart money are reallocating or re-positioning, or that retail investors are panic selling or switching contracts. Such times often brew the next big market movement (upward or downward), so stay vigilant!
Hook: "Is the high liquidation amount the end of 'bodies lying everywhere' or a signal for 'new retail investors entering the market'? Before the next big market movement starts, there will definitely be a more brutal battle between bulls and bears! Follow Dasheng, next issue reveals: How do market makers use the 'liquidation line' to precisely harvest? Comment 'avoid pitfalls' to share your liquidation near-misses!"
Remember to follow Block Key to keep up with top analysts' perspectives and capture wealth signals in real-time!#币安HODLer空投PLUME