In K-line technical analysis theory, some determine the 'economic bull' through benchmark levels or economic conditions; some trigger bull markets through favorable policies, known as 'policy bulls'; others are driven by hot sectors, referred to as 'hot effect bulls'; most of these are defined by patterns that have already emerged.
As investors, it is not important whether the K-line is in a bull market after running for a period; what matters is that we can anticipate the arrival of the bull market before it starts, allowing us to participate at the bottom of the bull market!
The K-line momentum theory defines a bull market as: the large level determines the trend, while the small level determines the movement.
A bull market must be a rebound trend formed by a large-level zero axis. Any significant bull market trend is a rebound trend formed by K-lines at a large time level's zero axis.
The following two major cases: the bull market of BTC and the bull market of US stocks
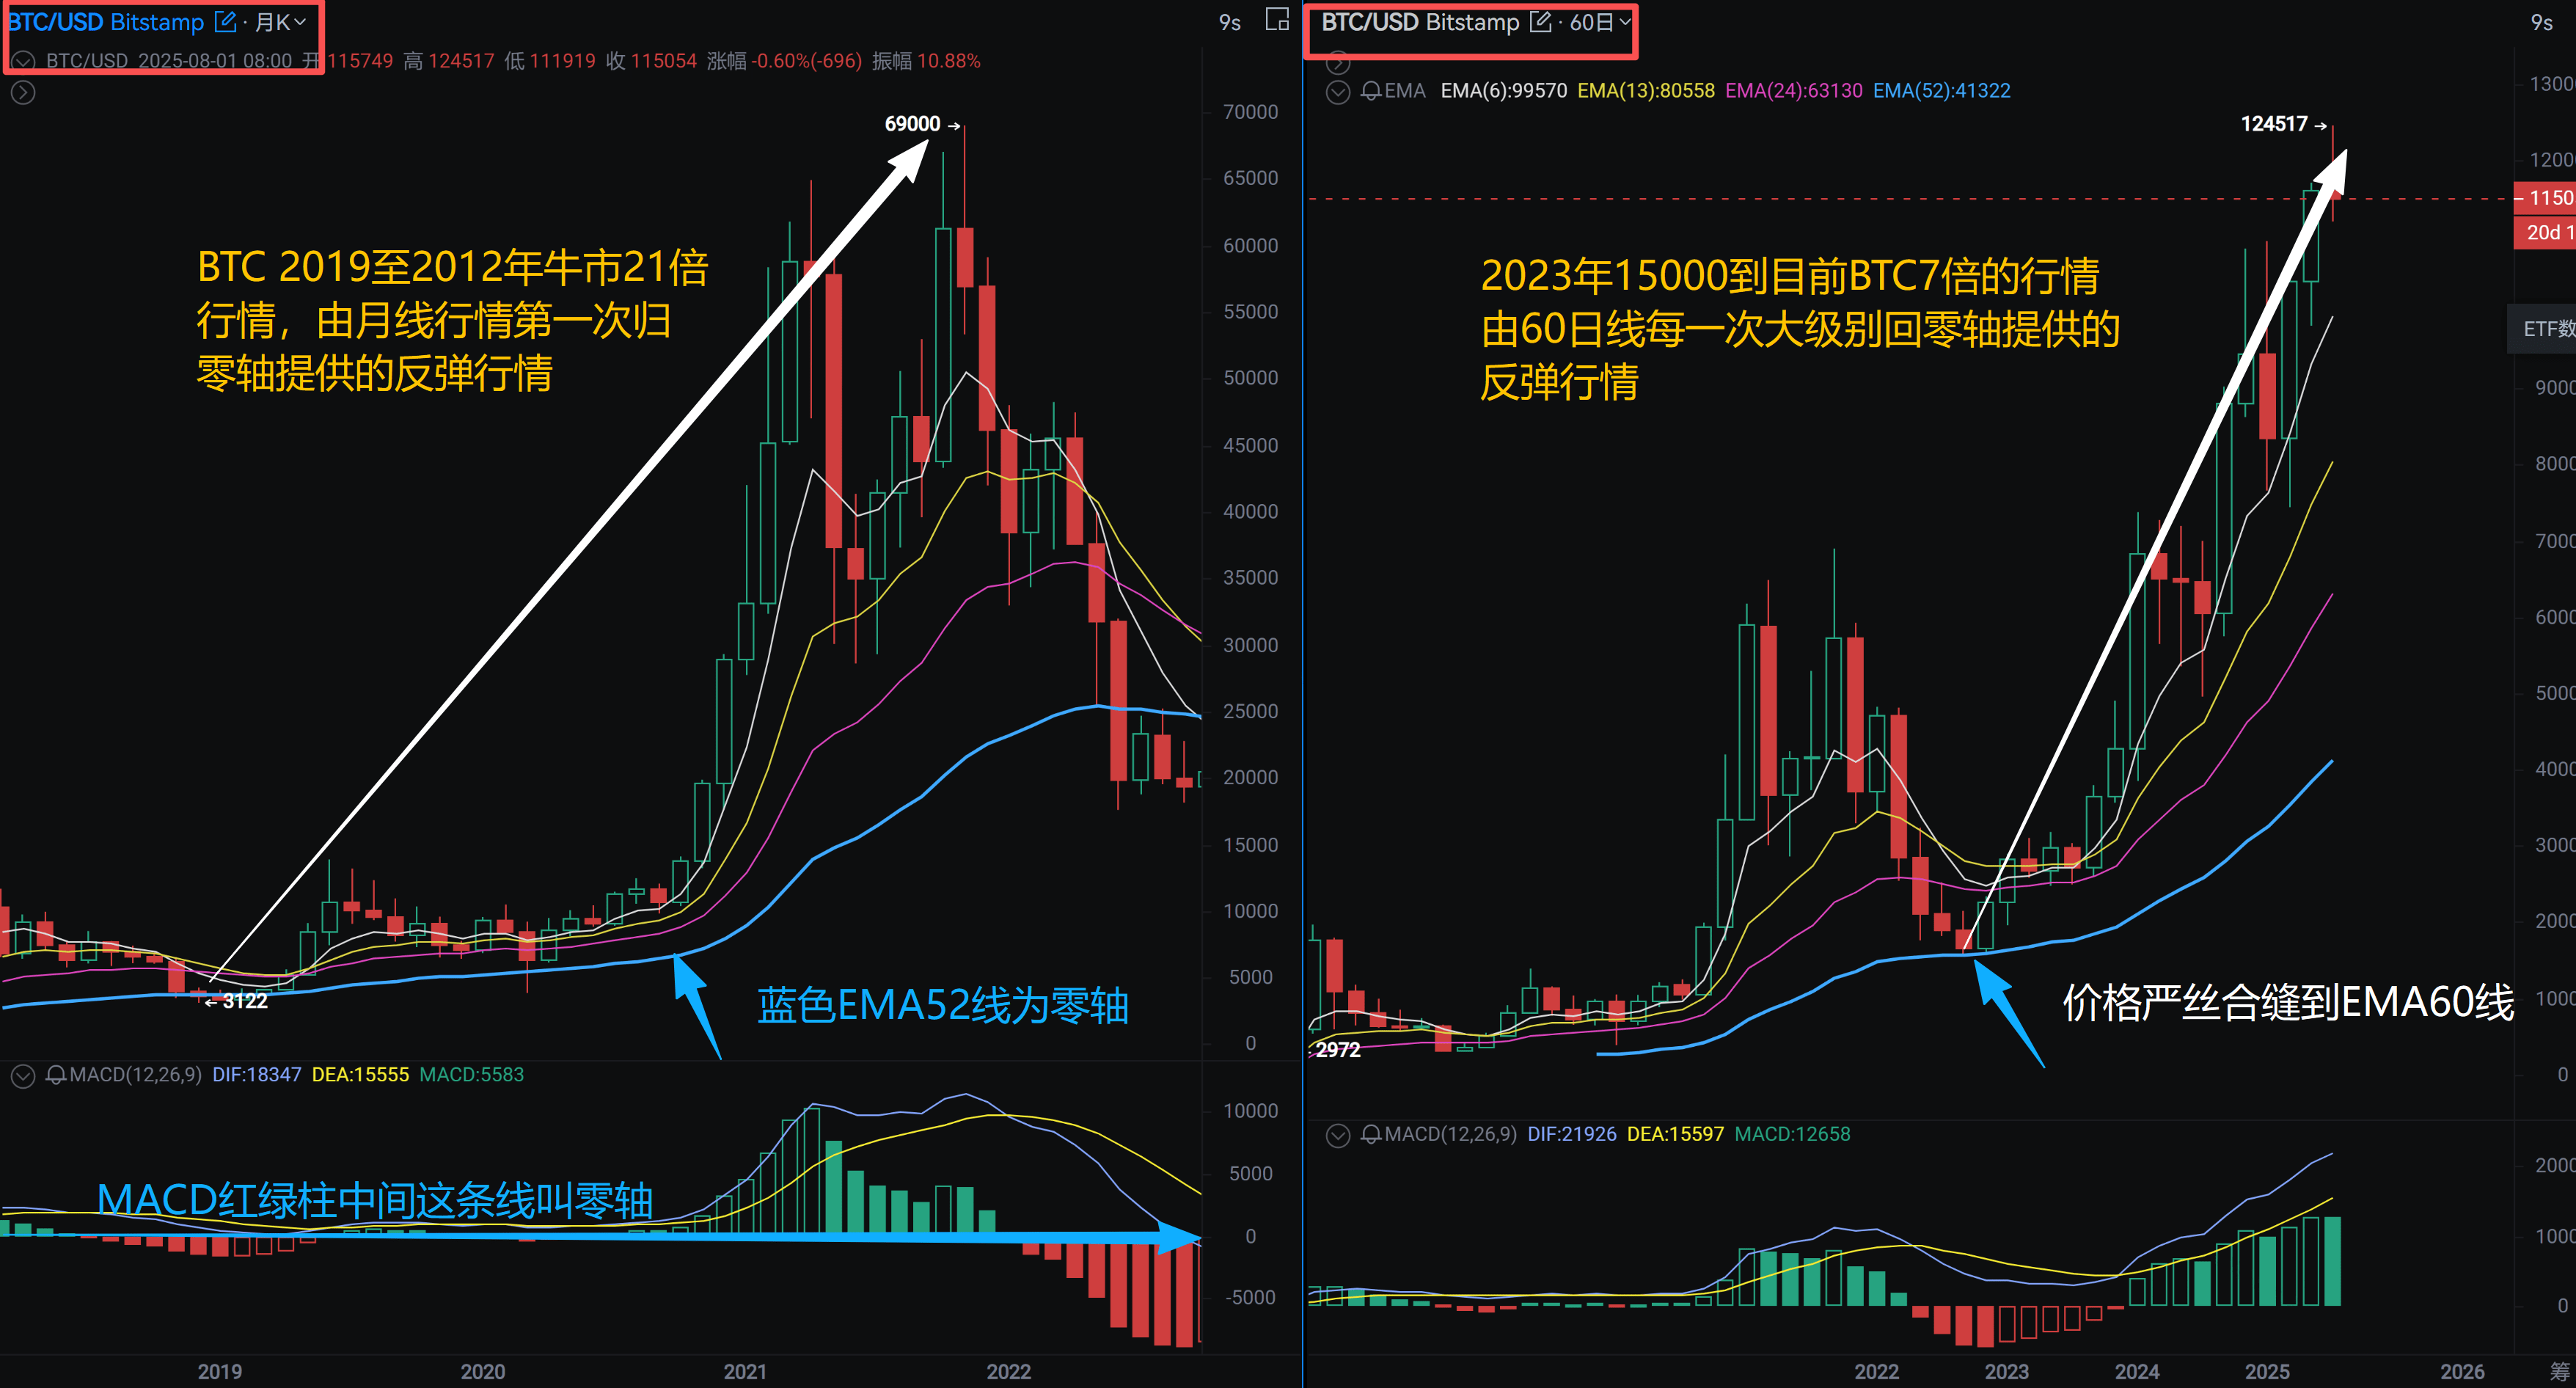
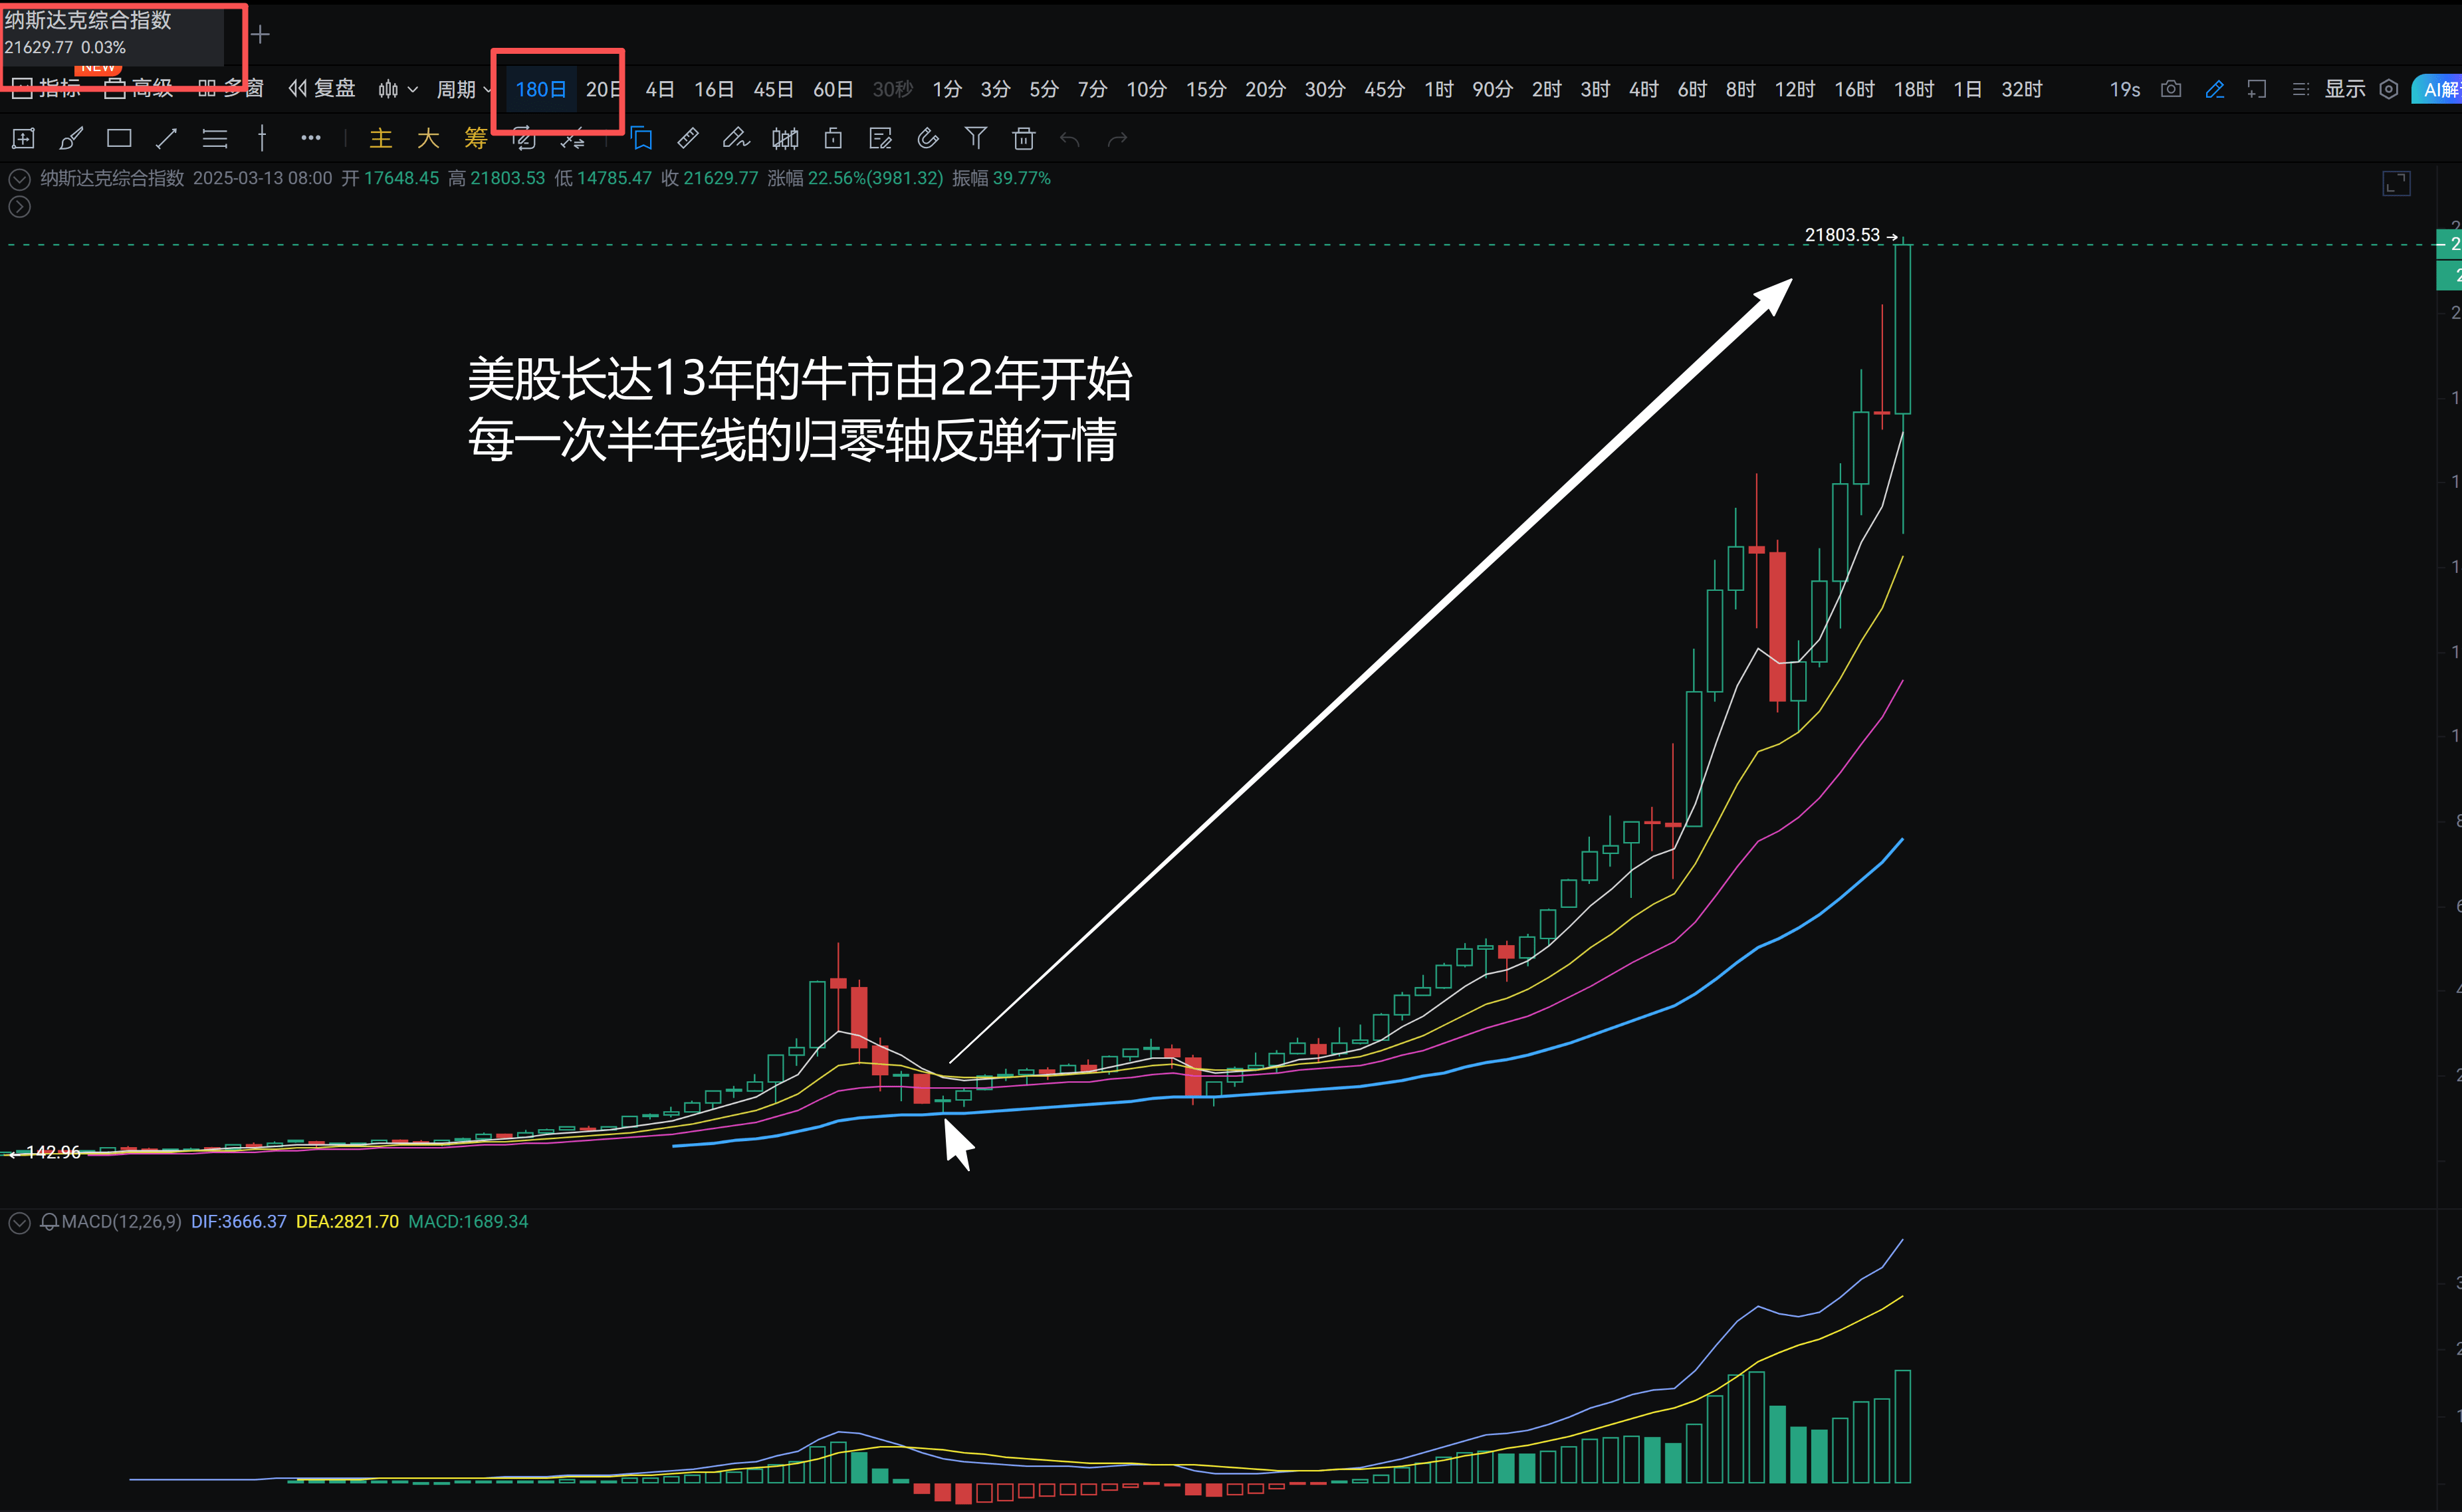
The rise and fall of K-lines is related to the zero axis, all derived from the rebound momentum provided by a certain time level's zero axis. There is no rise or fall without reason; every rise and fall has its justification. Whether in the stock market, foreign exchange, futures, or digital currency, as long as it is a normal financial K-line, its rise and fall follows a pattern.
