Currently, Bitcoin is in a bear market, which has become a consensus among the public and institutions. I had already predicted on November 14, 2025, that Bitcoin would enter a bear market, and I provided the target price for Bitcoin's decline and its probability. At that time, I estimated the probability of Bitcoin's price dropping to around 58,000 to be 65%. Currently, the lowest spot price is 60,000, which is 2,000 points away from the predicted low. Interested friends can check the screenshot of that tweet:
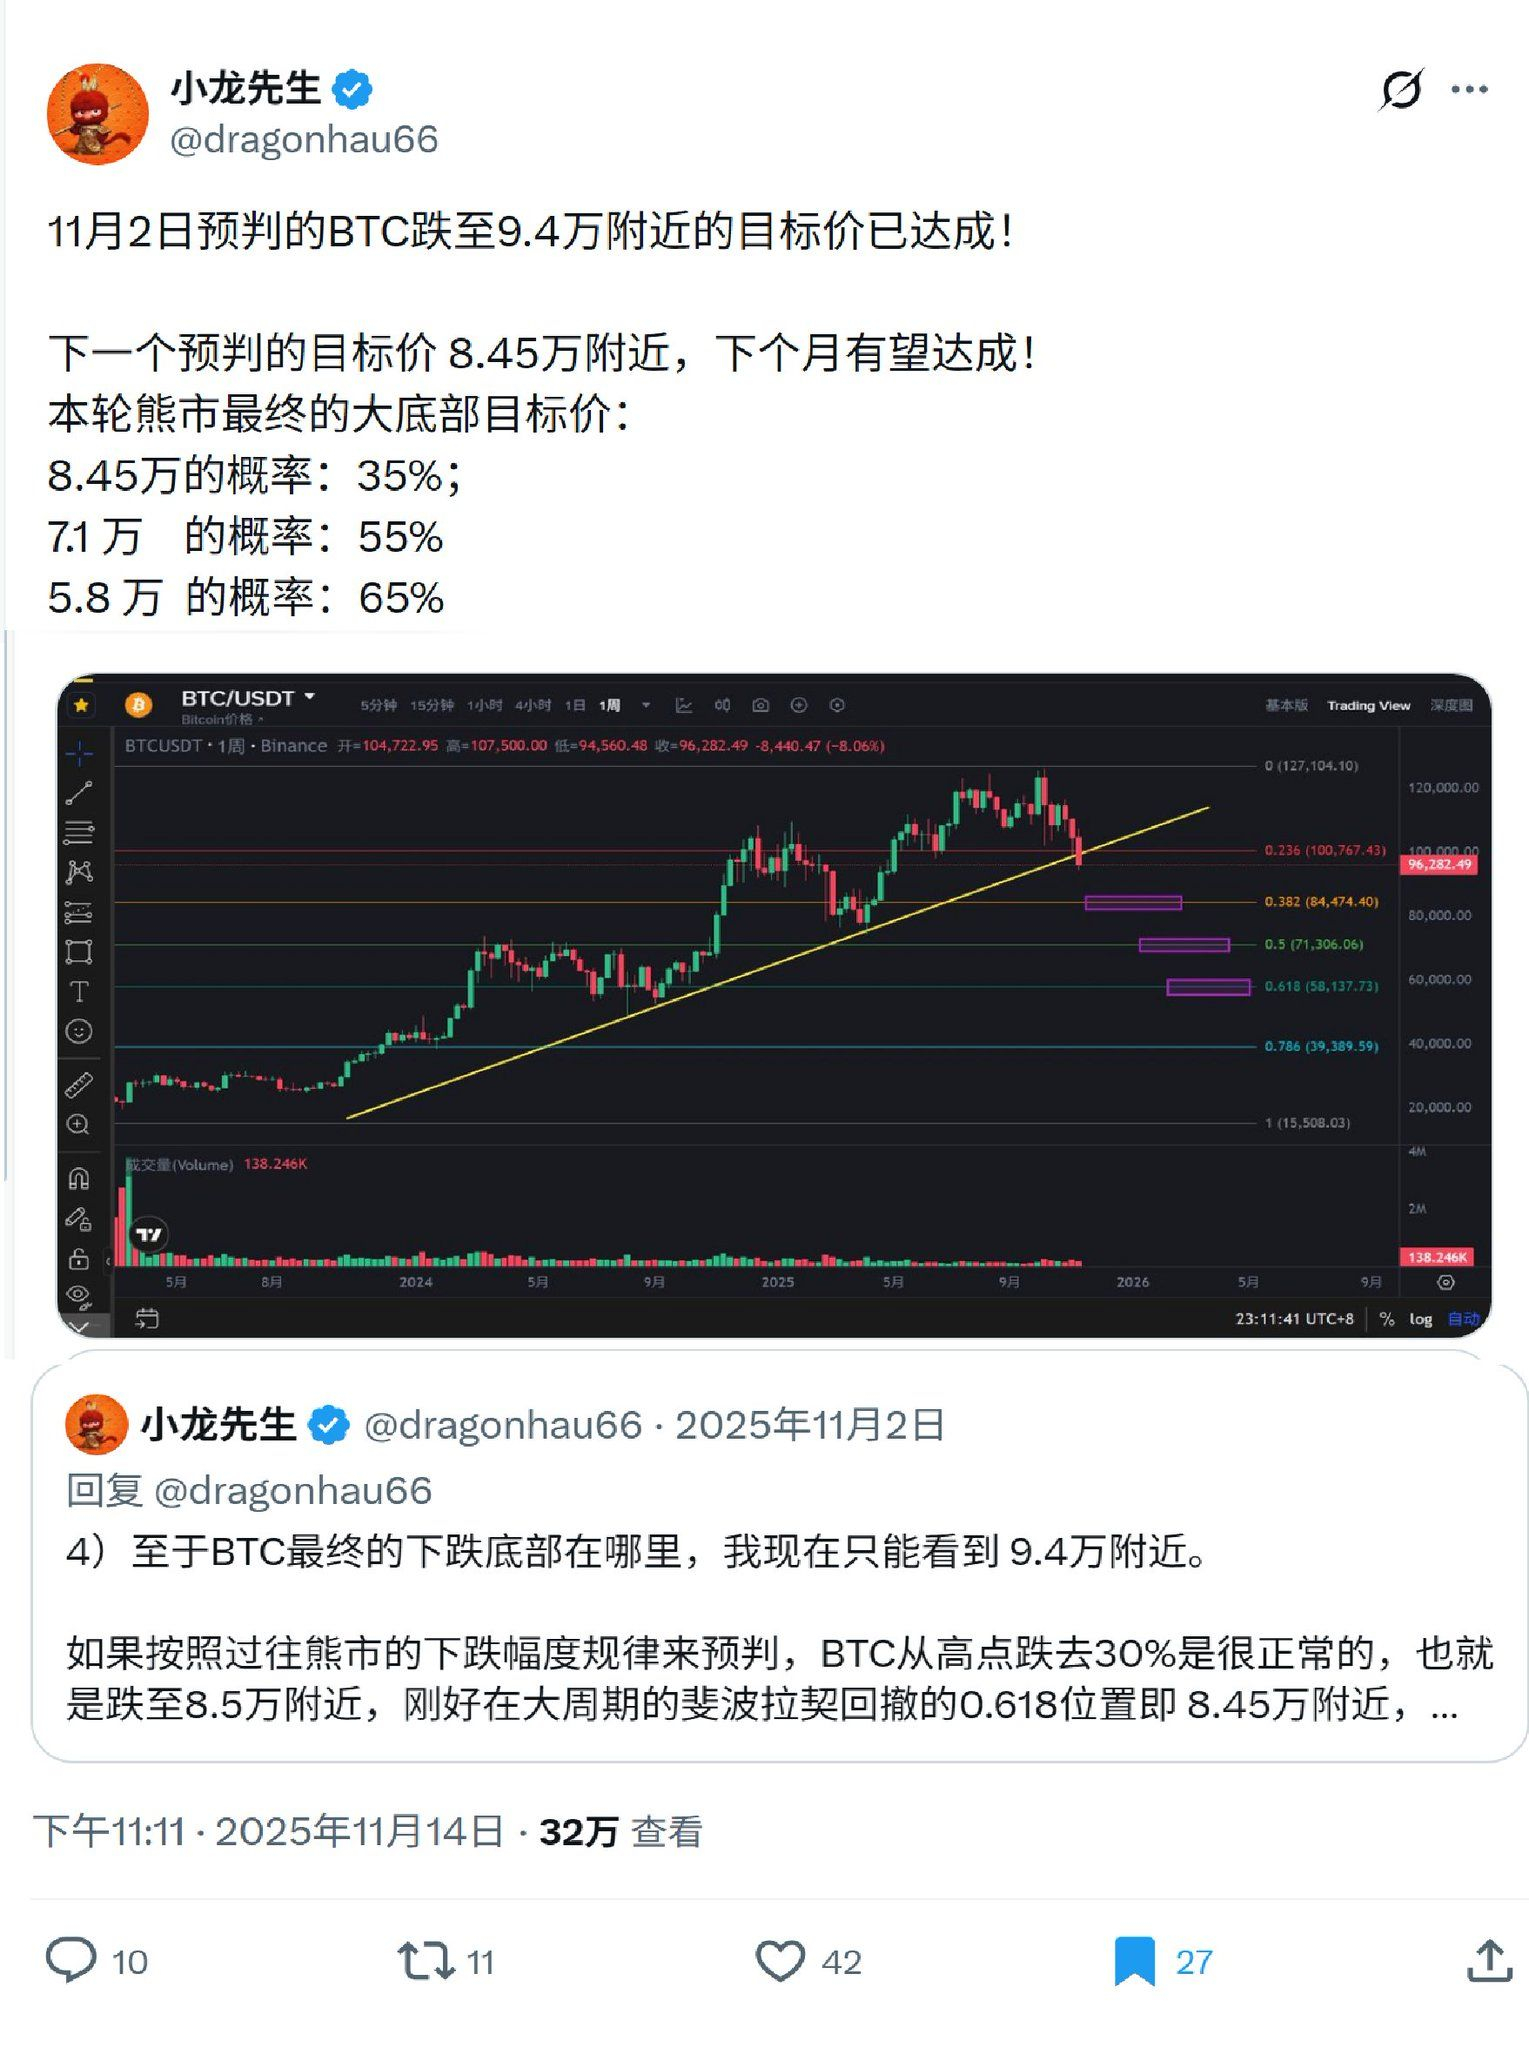
Now, I will again predict the target price for Bitcoin's major bottom in this round of the bear market:
Probability of 45,000: 75%; Probability of 40,000: 85%; Probability of 38,000: 80%.
Why do I predict that the target price for Bitcoin's bottom in this bear market is around 40,000? Please listen as I analyze and deduce this carefully. I once published an award-winning article on Binance Square that won 1 BNB (Understanding Bitcoin's price trend in the next three to four months to help you seize profit opportunities in advance!) and said: We need to understand the laws of a financial market: the trend direction in the medium to long term is determined by the flow of funds and the strength of volume, not by K-line shapes and structural patterns. Only by understanding on-chain data and fund flows, as well as analyzing the strength changes of bullish and bearish volumes, can we accurately predict the trend direction in the medium to long term.
Today, I continue to predict and deduce the medium and short-term trend of Bitcoin for the next year from four aspects: the latest institutional fund flow, the strength of bullish and bearish volume, market sentiment, and historical bear market data, to help friends understand and see through the alternating bull and bear markets of Bitcoin in the coming year, and seize the opportunity to make big profits in the medium-term trend.
1) The fund flow of spot ETF institutions
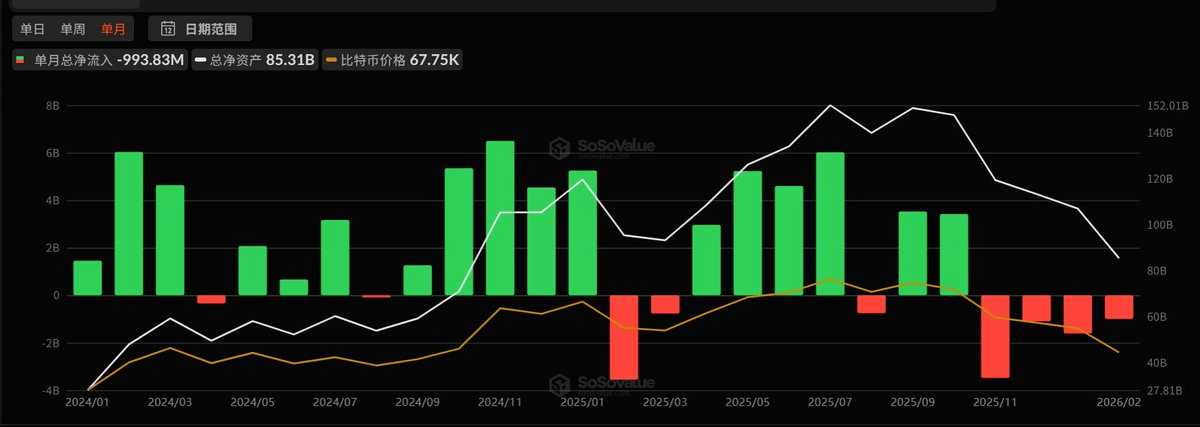
ETF institutions have become the backbone that influences and dominates the medium to long-term price trend of Bitcoin. Therefore, to analyze and predict the trend direction of Bitcoin's price in the medium to long term, we must pay attention to the fund flow of spot ETF institutions. Let's first look at the recent four months of fund flow data from ETF institutions in the chart below. The recent net outflows of spot ETF institutions over the last four months are:
November 2025: -3.48 billion; December 2025: -1.09 billion;
January 2026: -1.62 billion; February 2026: -0.993 billion (as of February 21);
Next, let's look at the weekly fund flow chart of spot ETFs:
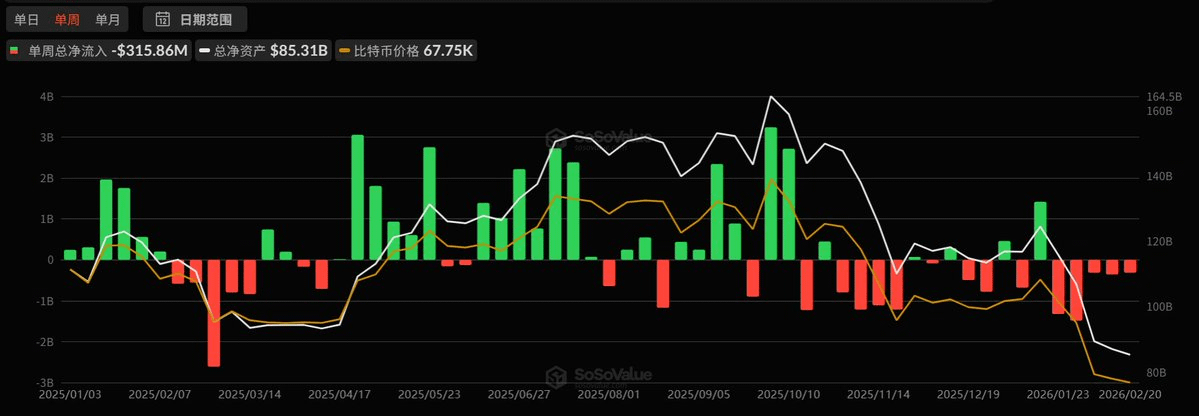
Since the crash on 1011, the weekly fund flow of spot ETFs has basically been net outflows, with only five weeks in the green volume bars shown in the chart above being in a net inflow state.
This data objectively shows: Spot ETF institutions have been continuously reducing their BTC holdings for four consecutive months, and the current price of Bitcoin has clearly not fallen to the level at which ETF institutions would buy again. If we say that 60,000 USD is the bottom price of this bear market, I believe that smart people would shake their heads in disagreement. I certainly disagree; didn't I provide the predicted target price and its probability for the bottom of Bitcoin in this bear market above?
From the weekly fund flow chart of spot ETFs, we see that the spot ETF institutions bought a large amount of BTC above the price of 95,000, especially during the week of October 3, 2025, when the price of Bitcoin was around 122,000, with a net inflow of 5.324 billion USD; this price level is very close to the previous bull market's highest point of 126,000 USD. It can be said that ETF institutions are just large retail investors. When we see spot ETF institutions panic selling a large amount of BTC, it will basically be close to the time point of the bottom price in this bear market.
2) Changes in the strength of bullish and bearish volume
The price of Bitcoin experienced a waterfall crash on October 11, 2025, with a significant bearish volume in a four-hour period, as seen in the yellow energy bar in the chart below, setting the tone for Bitcoin's entry into a medium-term downtrend. Currently, there is no sign of bullish volume, but we see bullish secondary volume on November 21, 2025, and February 6, 2026, as indicated by the blue energy bar in the chart below. Therefore, the price of Bitcoin began a rebound that lasted about two months starting from November 21, 2025, and another rebound starting February 6, 2026. These are two dead cat bounce events in this bear market downtrend, and the price has not truly bottomed out.
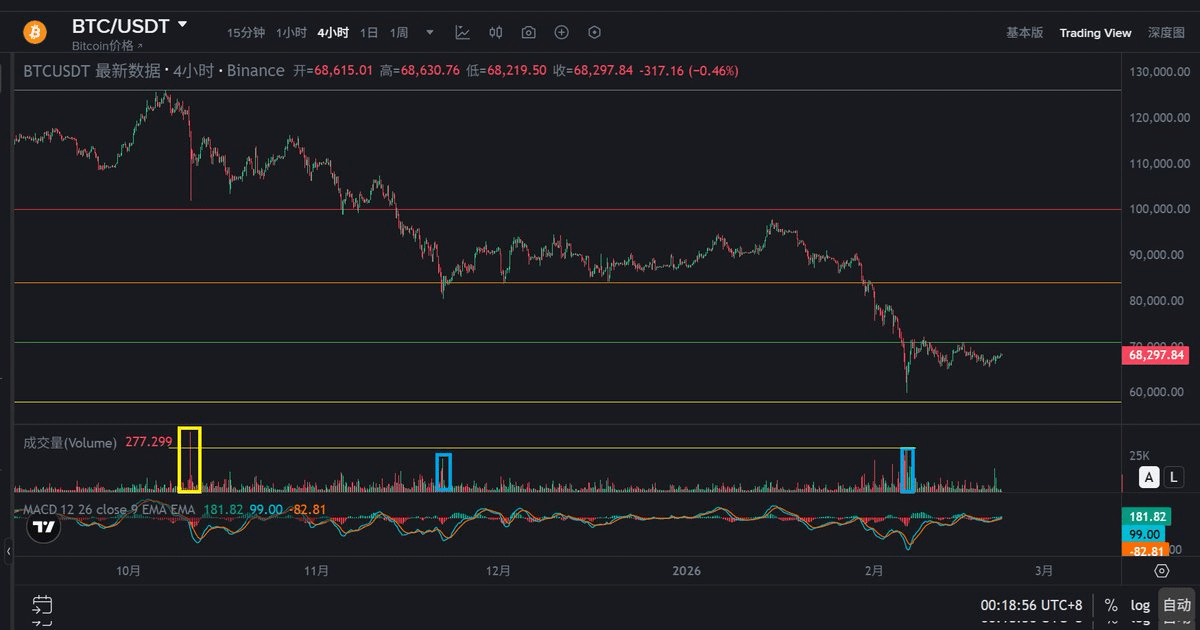
When one day we see a large bullish K-line appear in the four-hour chart accompanied by extremely large trading volume, meaning there is strong bullish volume and absolute strength, the bottom price of this bear market is likely to appear.
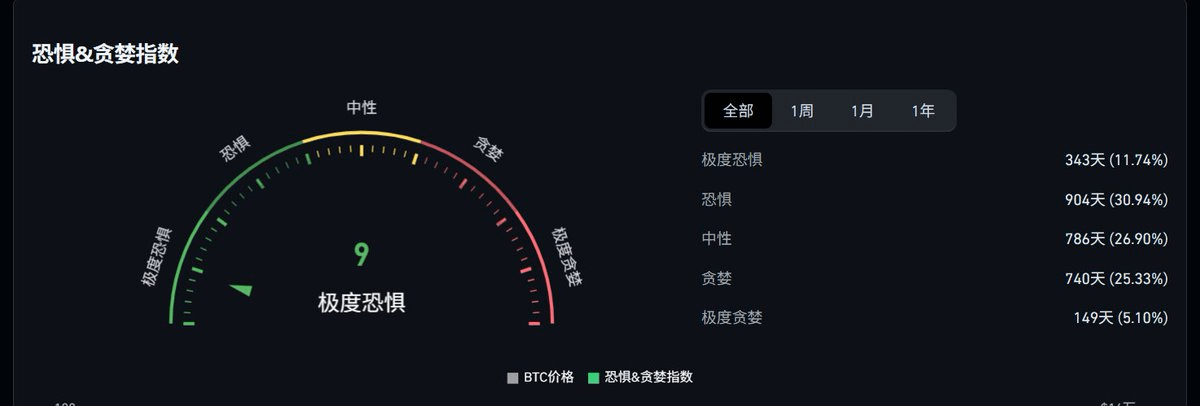
3) Market sentiment in the cryptocurrency space
The latest Fear & Greed Index is 9, and the current market sentiment in the cryptocurrency space is in a state of extreme panic. However, has there been a black swan event of institutional liquidation or margin calls in this bear market? Are the public and institutions currently in a state of near despair? The answer is: obviously not! The current bear market is in the mid-to-late stage and has not yet entered the most desperate final stage, which means that Bitcoin's price has not yet fallen to the final bottom price of this bear market.
4) The price decline and duration of Bitcoin in previous bear markets
By reflecting on history, we can understand the rise and fall; by reflecting on others, we can clarify gains and losses. Let's first take a look at the data chart of the price decline and duration of Bitcoin in previous bear markets:
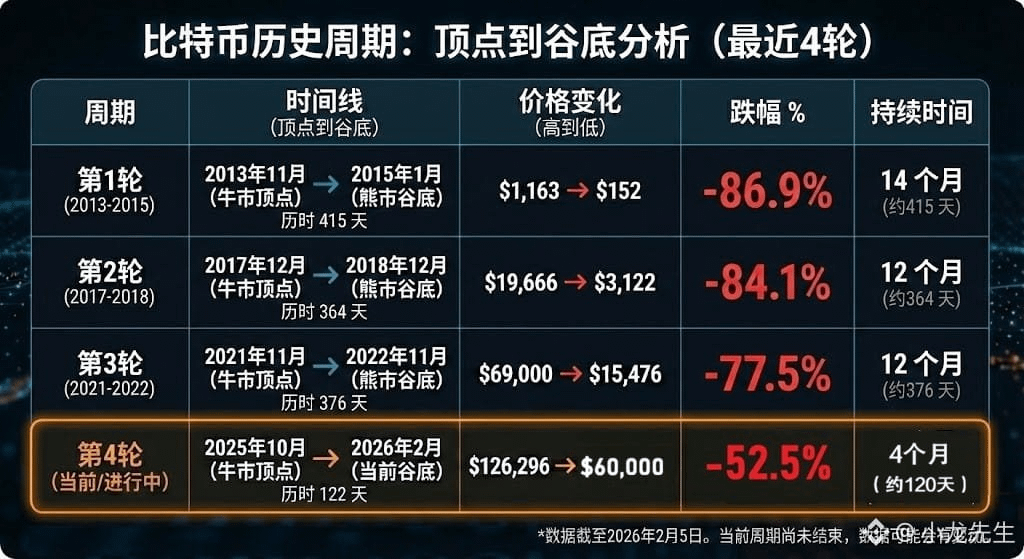
From this chart, we see that in the previous three bear markets, the price of Bitcoin fell by more than 75%, with a duration of over 12 months. In the current bear market, Bitcoin has fallen from a high of 127,000 to a low of 60,000 today, with a decline of about -52.5%, and a duration of 137 days, which is just over 4 months. This is far from the price decline and duration seen in previous bear markets. This data indicates that in this bear market, Bitcoin's price has not yet reached the true market bottom, and the bear market is still ongoing, in the mid-to-late stage.
Next, I boldly predict and deduce the price trend of Bitcoin in the next year.
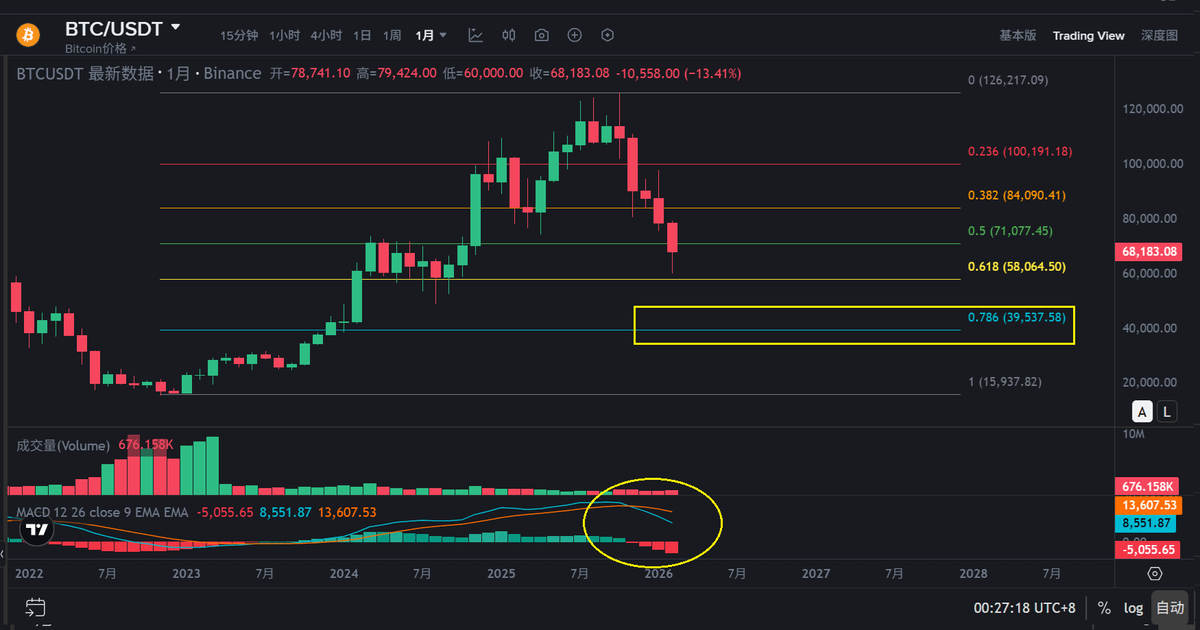
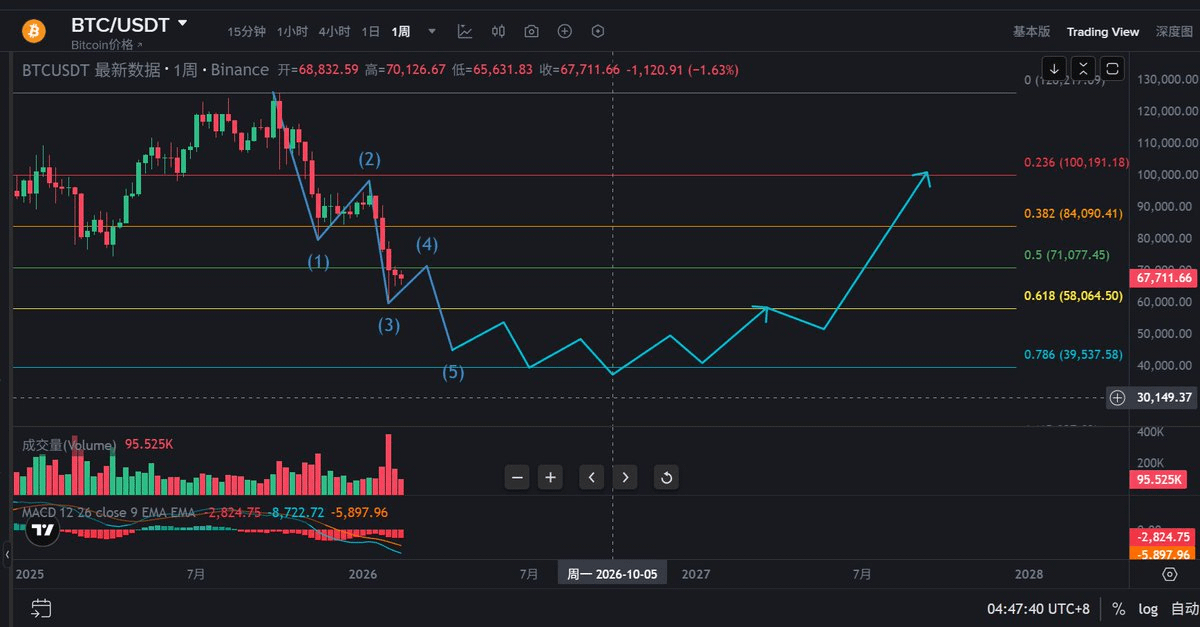
1) Monthly charts look at space, while weekly charts look at trends. From a monthly perspective, Bitcoin's MACD is still in a high position with a death cross, and trading volume remains sluggish, so the price is likely to continue to decline and explore the bottom, at least down to around 45,000 or even 40,000 before it can find a bottom.
2) From the perspective of wave theory and weekly Fibonacci retracement, the price decline trend of Bitcoin is showing a classic five-wave downward pattern. The price dropping to 60,000 has reached the Fibonacci retracement level of 0.618, where there is strong gravitational and support effect, and it will begin a rebound, which is the 4th wave dead cat bounce in the five-wave pattern. I estimate that the first target price of this rebound will be around 72,000, and the second target price will be around 75,000, and I estimate that the rebound may last until around March 15. Please forgive me for not being able to predict the specific end time of the 4th wave rebound.
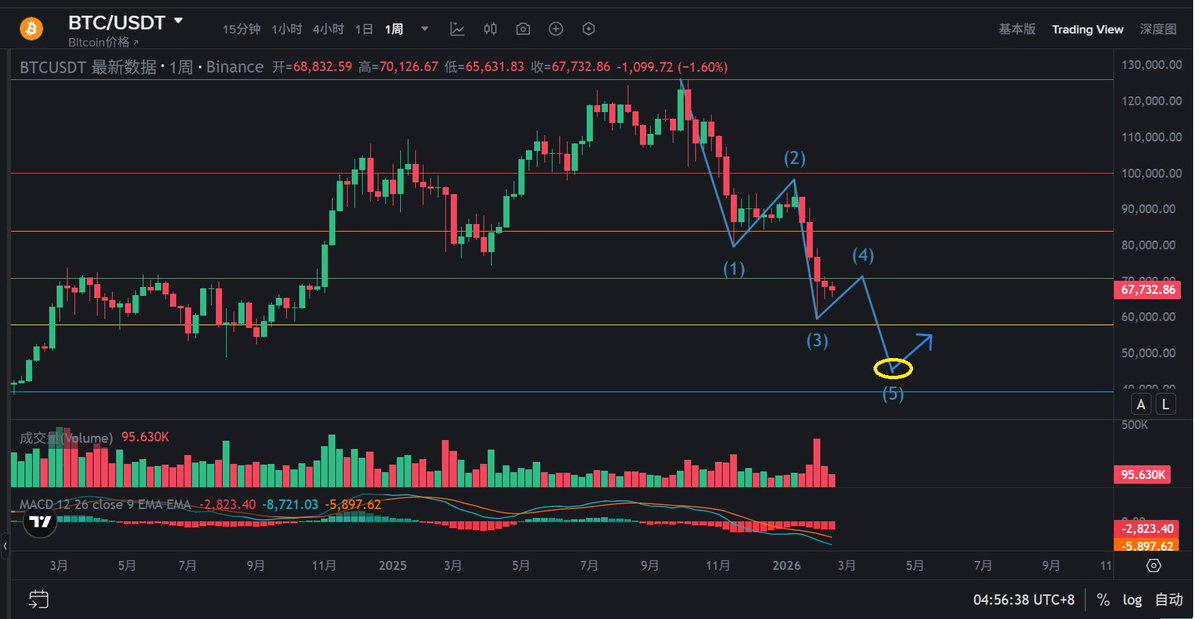
3) After the rebound ends, the price of Bitcoin will continue to decline and explore the bottom, starting the final downward wave of the 5th wave. I estimate that the price of Bitcoin is likely to fall to the Fibonacci retracement level of 0.786, around 40,000, and it may also fall to around 45,000, after which there will be a rebound triggered by bottom fishing, and after the rebound is completed, the price will continue to decline, and there may even be a quick drop that digs out the big pit of this bear market to a level of 35,000-38,000.
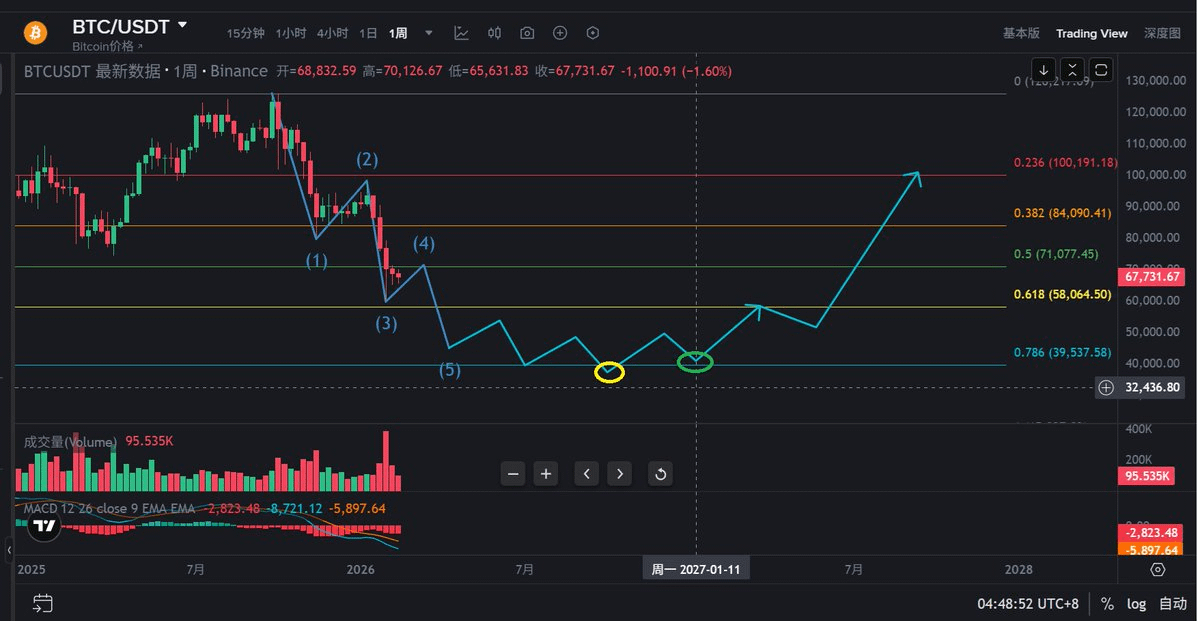
If the price of Bitcoin finally falls to 38,000, then the decline will be -70%; if we calculate based on the historical bear market duration of 12 months, this bear market will end around October 5, 2026, which means that the real market bottom price for Bitcoin at 38,000-40,000 could very likely appear before October of this year. Below is my forecast chart for Bitcoin's price trend over the next year, noting two key time points: October 5, 2026, and January 11, 2027. The time point for Bitcoin to reach its true market bottom price in this bear market is: around October 5, 2026; the time point for confirming the second bottom after Bitcoin's price bottoms out is: around January 11, 2027. Please forgive me for not being able to provide specific time points for when Bitcoin's price truly bottoms out and confirms the second bottom.
In the face of the ongoing decline of Bitcoin's price in the mid-to-late stage of the bear market, and the long waiting period of at least two or three months required after the price bottoms out for consolidation, what strategies and plans should we adopt to cope with the current bear market and the future bull market? My suggestion is:
1) For those who are not good at short-term trading and contract trading, we should take advantage of this bear market rebound and the downward exploration period (at least until around October this year) to explore other channels for making money and accumulating capital, to prepare enough capital and ammo for next year's bull market. For now, let's let this bear run for a while and wait for the end of this year and early next year when the bull market starts, so that we have enough capital and ammo to shoot at Bitcoin, this golden cow.
2) For those who are good at short-term trading and contract trading, we can short Bitcoin in the middle of the 4th wave rebound high on the weekly chart to seize profit opportunities from the medium-term decline trend, waiting for Bitcoin to drop to 40,000-45,000 to close our short position before considering going long in the medium to short term.
3) For stable investments, the right time to build a significant position in Bitcoin spot and layout for the medium to long-term bull market is, in my opinion, still to wait until around October this year to enter the market for bottom fishing. Of course, for aggressive investors, we can also start to buy Bitcoin spot in batches around 45,000. When the price of Bitcoin drops to around 45,000, buy 20% of your position in Bitcoin; when the price drops to around 40,000, continue to buy 50% of your position; if Bitcoin's price really drops sharply to the level of 35,000-38,000, then we can be a bit bolder and shoot out the remaining 30% of our position to bottom fish Bitcoin.

"Buy when blood flows in the river, even if it's your own blood." Buying during market panic and selling at a loss, the courage to buy at this time is to conquer oneself and the weaknesses of human nature: fear. Therefore, buying in batches when Bitcoin's price falls to the range of 35,000-45,000 and making medium to long-term investments is, in my opinion, a wise choice and a trade with a high risk-reward ratio. If Bitcoin's price really drops to an extreme situation of 28,000-35,000 around October this year, that would definitely exceed my understanding and expectations. However, I believe that the probability of such an extreme price occurring is very low, only about 10%.
The essence of trading is a game of probabilities. Since we are going to play the game, we should participate based on our understanding of probabilities and market cognition, willing to take responsibility for our bets.

I am Mr. Xiao Long, inheritor of the natural trading theory, Bitcoin market analyst, and established a three-dimensional trading system of natural trading theory + on-chain data + volume-price relationship. One of my dreams is to become a professional market analyst and trader, helping more friends accurately grasp the market and make money.
The above analysis of Bitcoin's market and price trend forecasts is not investment advice, only for reference. Writing this article predicting Bitcoin's price trend for the next year is not easy. If you think this article is good, please follow me, give this article a like, and share it. Thank you for your support! Thank you for reading!