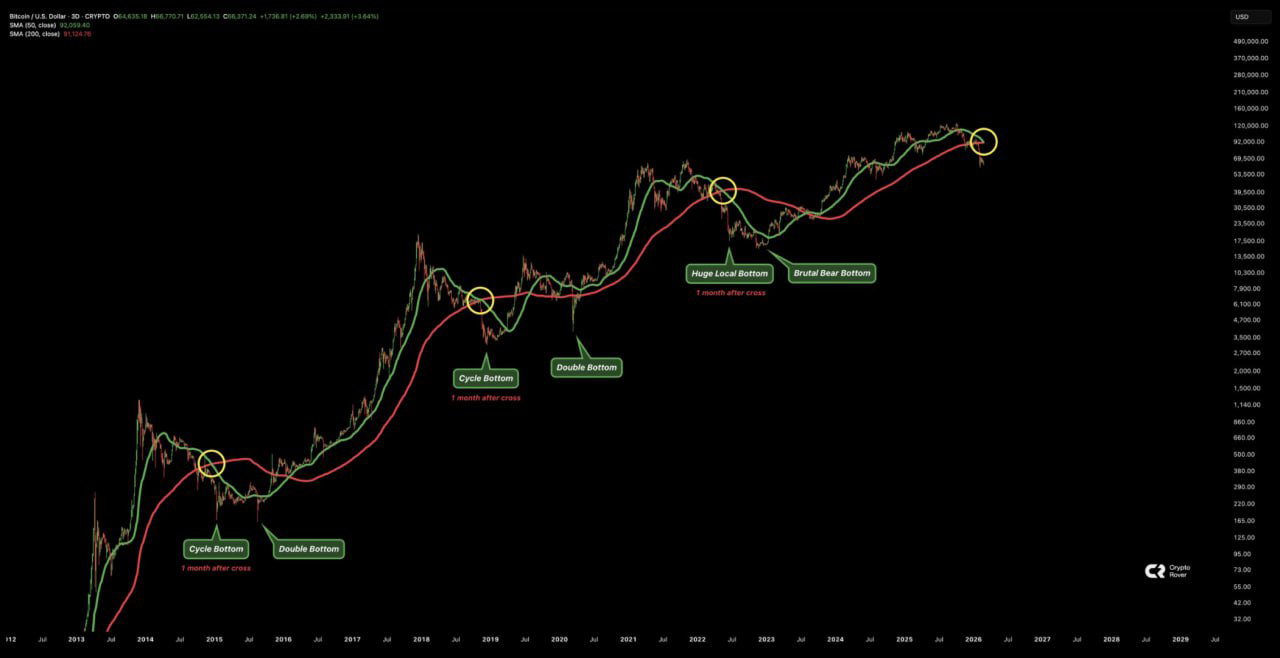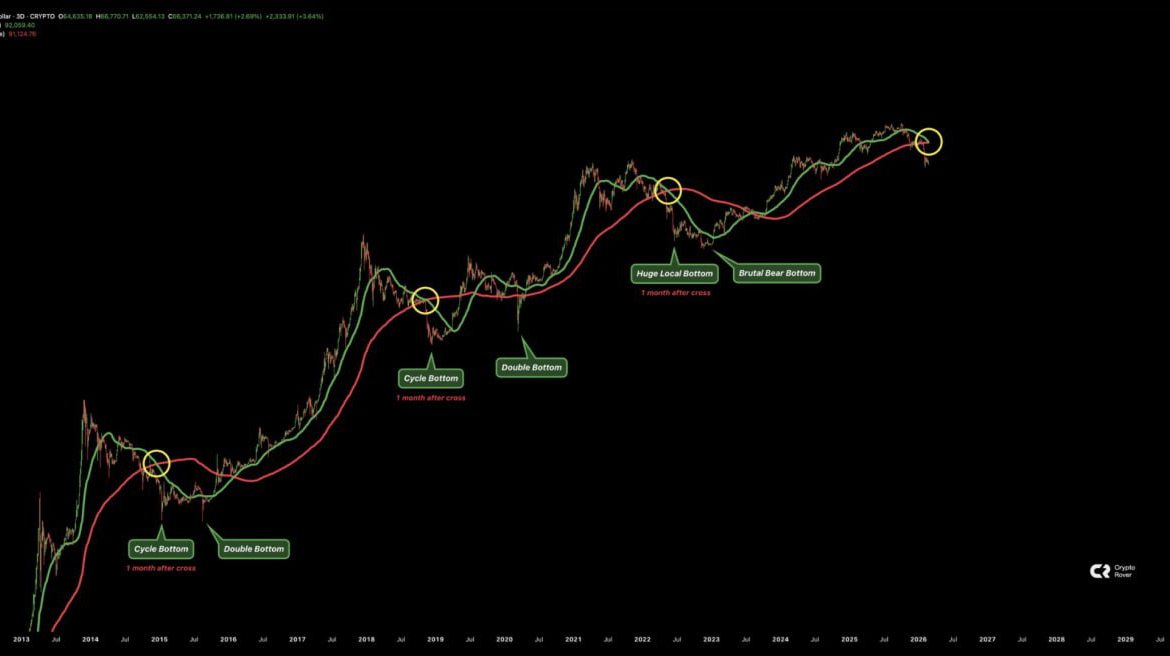
50 SMA is 'close to' 200 SMA on BTC's 3-day chart → this signal usually appears only once per cycle and often occurs right during the bear phase.
Looking back at previous cycles:
🖤 2015 & 2018: $BTC often creates cycle bottoms ~1 month after the cross occurs
🖤 The most recent cycle: formed a local bottom ~30 days after the cross, then moved sideways ~5 months before the final shakeout
Currently, the 2 MA lines have not confirmed a complete cross, but BTC price has been below for a long time -> indicating that the downtrend is still dominant
BTC has reached the 70K mark, and there will be significant fluctuations in the near future. Remember to turn on notifications & closely follow the plan at HC Tradecoin
❗️This article is intended to provide information only and is not investment advice! #DYOR #NFA