Most traders on Binance fill their charts with 10+ indicators — RSI, MACD, Bollinger Bands, Stochastics, Ichimoku, and more. But here’s the reality: more indicators = more confusion.
Professional traders don’t chase dozens of signals. They rely on a few proven tools that truly guide decisions. Let’s simplify and focus on the only 3 indicators you actually need:
---
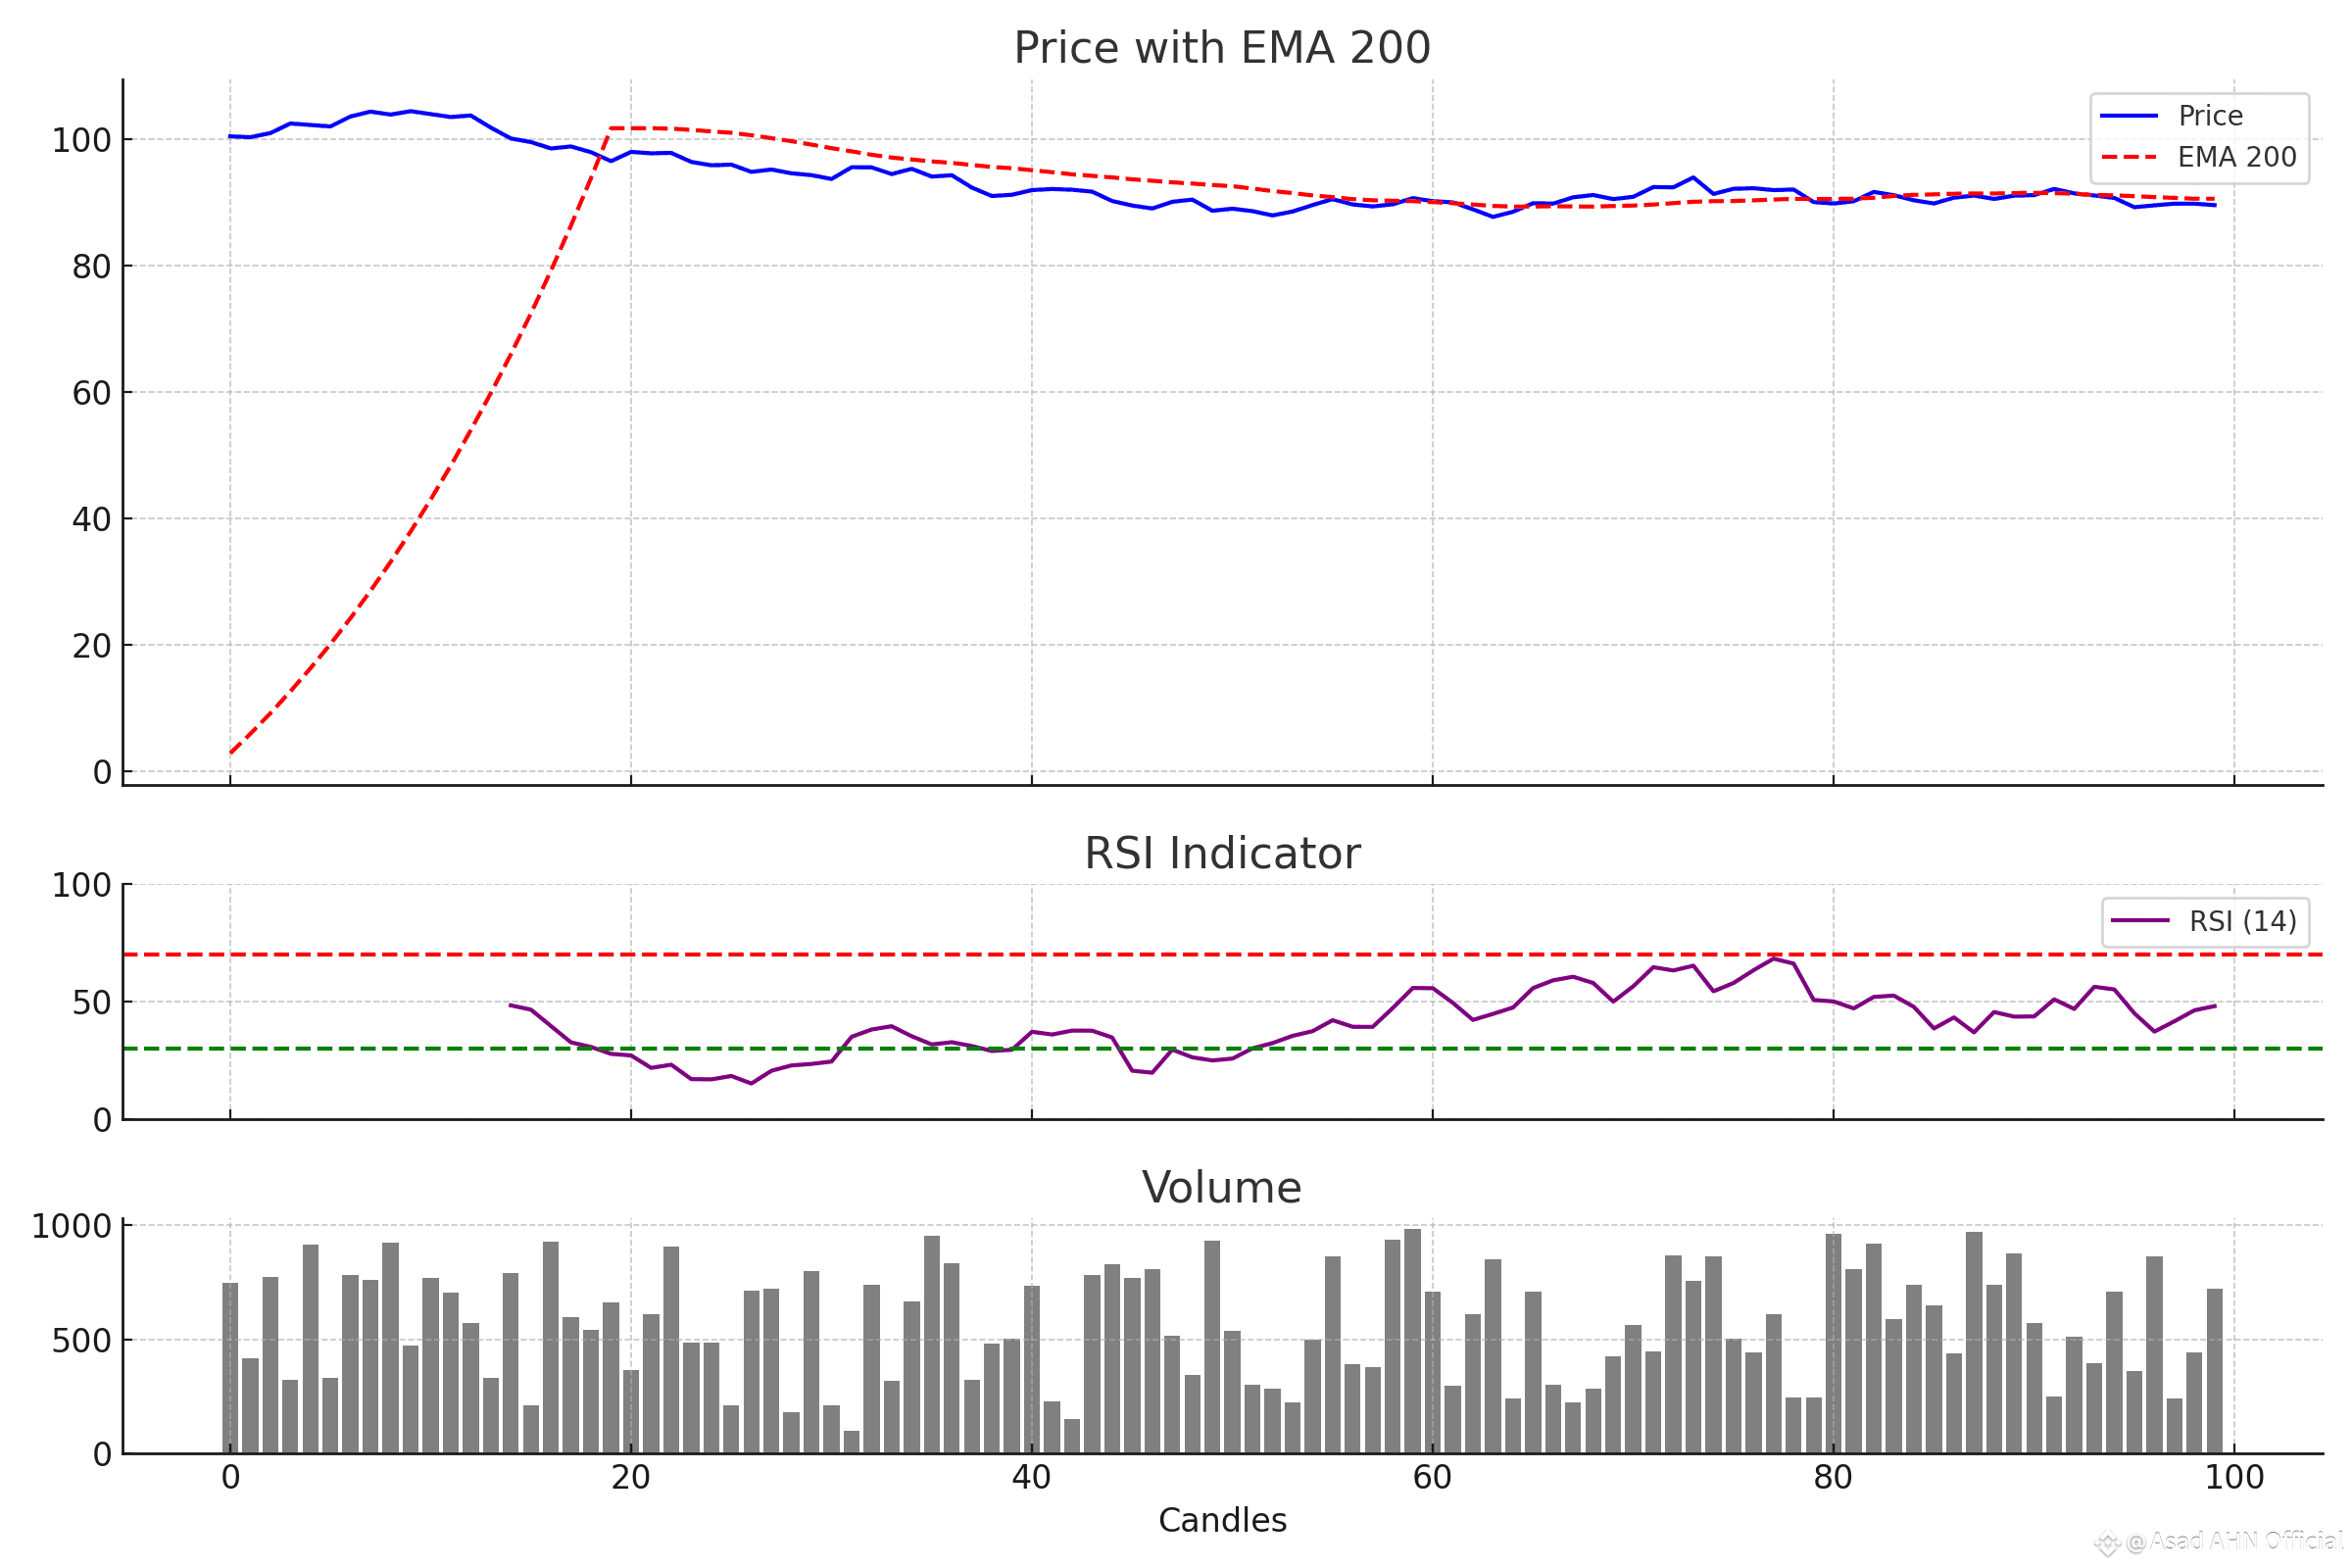
1. 200 EMA (Exponential Moving Average) – The Trend Master
What it shows: The long-term market trend using the last 200 candles.
Why it matters:
Price above 200 EMA → Bullish trend
Price below 200 EMA → Bearish trend
How to use: Watch how price reacts. Big players respect the 200 EMA, making it a strong support/resistance level.
---
2. RSI (Relative Strength Index) – The Momentum Gauge
What it shows: Whether a coin is overbought or oversold.
Key levels:
Above 70 → Overbought (possible drop)
Below 30 → Oversold (possible bounce)
How to use: Combine with 200 EMA. Example: If RSI shows oversold and price is bouncing on 200 EMA, that’s a strong buy setup.
---
3. Volume – The Confirmation Tool
What it shows: The strength behind a move.
Why it matters:
Breakout with high volume = Strong & real
Breakout with low volume = Weak & likely fake
How to use: Always confirm price action with volume before trusting the move.
---
The Winning Formula
Forget 15 messy indicators. Stick to these 3 essentials:
200 EMA → Trend direction & dynamic S/R
RSI → Momentum & reversal zones
Volume → Real vs fake confirmation
This combo works on any coin, any timeframe.
---
Final Note
Trading isn’t about who uses the most indicators — it’s about who reads the market best.
Keep your charts clean. Next time you trade, just ask:
👉 What are EMA, RSI, and Volume telling me?
That’s usually all you need.#EMA200 #RSI #Volume #MarketRebound