summary table (cheat sheet) of popular Japanese candlestick patterns in technical analysis when trading stocks, forex, crypto, etc.
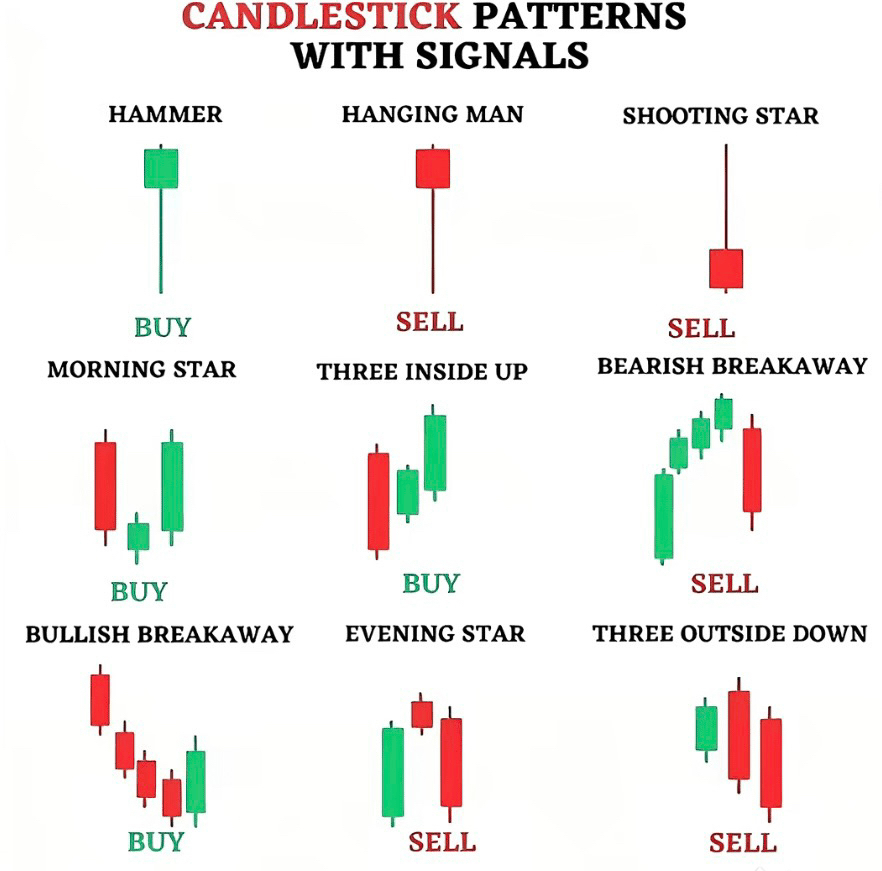
Images of some of the most important candlestick patterns, along with corresponding buy (BUY) or sell (SELL) signals. These patterns help traders predict the likelihood of reversal or trend continuation.
Single candlestick patterns
Hammer (Hammer):
Small body candle on top, very long lower wick (usually 2–3 times the body).
→ Appears at the end of bearish trend → BUY (strong bullish reversal signal).Hanging Man (Hanging Man):
Shape similar to Hammer but appears at the end of bullish trend.
→ SELL (bearish reversal warning).Shooting Star (Shooting Star):
Small body candle on the bottom, very long upper wick.
→ End of bullish trend → SELL (very strong).
Triple candlestick patterns
Morning Star (Morning Star):
1 strong bearish candle → 1 small candle (doji/spinning top) → 1 strong bullish candle.
→ End of the bearish trend → BUY (one of the most reliable bullish reversal signals).Three Inside Up:
Large bearish candle → small bullish candle contained within the previous candle (harami) → strong confirming bullish candle.
→ BUY (bullish reversal).Bearish Breakaway (Breakdown):
Usually a series of strong bearish candles after a “breakout” from an accumulation or resistance zone.
→ SELL.Bullish Breakaway (Breakout):
Conversely, a series of strong bullish candles break support/bearish trend.
→ BUY.Evening Star (Evening Star):
1 strong bullish candle → 1 small candle → 1 strong bearish candle (mirror of Morning Star).
→ End of the bullish trend → SELL.Three Outside Down:
Small bullish candle → large bearish candle “engulfing” the previous candle (engulfing) → confirming bearish candle.
→ SELL (strong bearish reversal).
In summary, this is a quick reference guide to identify candlestick patterns and basic buy/sell signals. In actual trading, you should also combine:
Appearance location (end of trend or middle of trend?)
Trading volume (volume)
Support/resistance area
Confirmation from the next candle (confirmation)
If relying solely on candlestick patterns without context, accuracy will decrease significantly.