Market Summary: Geopolitical Shifts, Emotional Recovery, Awaiting Validation.
The news of the death of Iran's Supreme Leader Khamenei became a market variable over the weekend. After experiencing a panic sell-off triggered by the escalation of the US-Iran conflict, the market staged a textbook V-shaped rebound over the weekend, with BTC prices quickly recovering from a low of $63,000 to above $66,000.
However, due to the closure of US stock markets and ETF markets over the weekend, the sustainability and quality of this rebound driven by geopolitical news will still await the 'final judgment' based on the real flow of institutional funds after Monday's opening.
1️⃣ ETF capital flow: The market was closed over the weekend, waiting for Monday's institutional votes.
Latest update: February 28 (Friday) is the last trading day of February, and the weekend (February 29, March 1) saw the spot Bitcoin and Ethereum ETF market closed, with no new data.
Review of last Friday: February 28 data showed that institutional buying consensus was temporarily interrupted due to geopolitical shocks.
BTC ETF: Net outflow -$27.5M (ending a three-day inflow), BlackRock IBIT outflow -$32.7M.
ETH ETF: Net outflow -$43.6M, BlackRock ETHA outflow -$42.99M.
Core signal: The weekend's V-shaped rebound has not received real-time verification from ETF funds. The capital flow after the opening of the U.S. stock market on Monday (March 2) will be the 'touchstone' to test whether institutions recognize the current rebound price level.
2️⃣ Sentiment: The index is pinned at 10, and retail investors are deeply trapped in icy fear.
Current Fear and Greed Index: 10 (Extreme Fear).
Trend analysis: The index has lingered at an extremely low level around 10 for several consecutive days. Although BTC price saw a significant rebound over the weekend, the retail sentiment index remained unchanged, indicating deep-rooted post-traumatic stress. This continued divergence between 'price rebound' and 'emotional freeze' is one of the typical characteristics of the market being in a large bottom area. Emotional recovery often lags behind price, and turning points usually require clearer fundamental or capital catalysts.
3️⃣ Derivatives data: Short squeezing is ongoing, revealing differentiation in local rates.
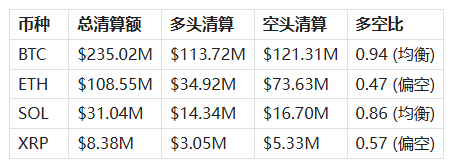
24h total liquidation data Coinglass:
Total liquidation: $401.06M
Long liquidation: $172.47M (43.0%)
Short liquidation: $228.59M (57.0%)
Main force liquidation details
Capital rate scan:
BTC average rate: 0.3151%, neutral
XRP rate: -5.29%, short crowded
The rates of mainstream cryptocurrencies like SOL and ETH generally remain negative or neutral and relatively low.
As much as 57% of the liquidation comes from shorts, combined with BTC rates returning to neutral, indicating that the weekend's rebound has triggered a wave of short covering. However, the deep negative rates of assets like XRP show that short positions are still crowded in certain areas, and once market sentiment improves further, a second round of short squeezing could easily occur.
4️⃣ RSI heatmap: Generally entering neutral recovery zone, technical rebound space is still available.
Overall sentiment of the top 50 cryptocurrencies:
RSI average has rebounded to the 40-45 range, transitioning from weak to neutral.
Individual cryptocurrency technical indicators (14-period RSI):
BTC: 40.6 (1d) — Out of oversold, entering neutral recovery.
ETH: 43.0 (1d) — Recovery momentum is stronger than BTC, with 4h level having turned strong.
SOL: 44.1 (1d) — Synchronized recovery, with 4h level skewed towards strength.
The rapid decline caused by geopolitical shocks has pushed many assets' short-term technical indicators back into a weak zone, but it has not caused a trend breakdown. The vast majority of mainstream cryptocurrencies have not yet entered the overbought zone (above 70), indicating that the technical space for this rebound has not been fully exhausted.
5️⃣ Whales and ammunition: Stablecoin ammo is increasing against the trend, Saylor holds firm.
Stablecoin fund pool:
USDT market cap: $183.765 billion
USDC market cap: $75.186 billion
Total: approximately $259.5B
Amid geopolitical shocks and severe market fluctuations, the total market cap of the two major stablecoins remains stable, with USDT even seeing a slight increase. This refutes the panic claims of significant capital flight, indicating that substantial funds are still on the sidelines or waiting for clearer entry opportunities.
MicroStrategy holding tracking:
Open interest: 717,722 BTC
Average cost: $76,020/BTC
Current market price: ~$66,102
Estimated floating loss: approximately -13.0% (floating loss amounting to about $7.1 billion)
Michael Saylor and his company have not made any reduction actions despite facing over 13% floating losses and dual pressure from geopolitical and market crashes. This steadfast stance provides the market with the most solid psychological and cost anchoring point, and is the ultimate manifestation of bullish belief.
Subsequent outlook
The market is undergoing a severe volatility test triggered by 'geopolitical changes.' The weekend's V-shaped rebound has restored the technical shape, but the core contradiction remains unresolved: Institutional capital (ETF) willingness awaits verification on Monday, and global macro sentiment (U.S. stocks, oil prices) is still constrained by the situation in the Middle East.
Key observation points (Monday, March 2):
U.S. stock market opening performance: Especially the response of tech stocks to the situation in the Middle East.
ETF capital flow: Observe whether institutions are taking profits during the rebound or recognizing current price levels to continue buying.
Middle East situation news: Any clear signals regarding the scope, duration, or diplomatic developments of the conflict.
Core logic: Panic index (10) + liquidation structure (long positions cleared) + stablecoin inventory (stable) + whales holding firm (Saylor) constitute typical elements of a bottom. However, confirmation of the trend requires institutional funds to vote with real money on Monday. Until then, the market is in a 'post-rebound observation period,' and high volatility will continue.
Stay tuned for analysis from Xiu Cai, revealing the truth behind the data! See you tomorrow!😘