Date March 2, 2026 8 PM
By Fabiano
Highlighted Asset$BTC
Context Bitcoin approaches a confluence resistance zone with declining volume, raising red flags for unsuspecting bulls.
 ⚡ 1. The Critical Moment: Resistance in Sight
Bitcoin has managed to recover impressively from recent lows near $60,000, driving the price back towards the upper limit of the broader trading channel. Short-term sentiment has improved, but the current technical scenario requires caution.
The problem? Multiple layers of resistance are converging now above the price, creating a dangerous confluence zone where the rally may lose strength.
Key Technical Points:
Channel Resistance: Price approaches the upper limit of the channel established since mid-February.
Fibonacci Confluence: A significant Fibonacci retracement level overlaps a previous high and descending moving averages.
Volume Decline: Trading volume has been consistently falling as the price rises.
When multiple technical indicators align within a narrow price zone, the market tends to react decisively. In this case, the overlapping resistance cluster increases the likelihood of a rejection, not a sustained breakout.
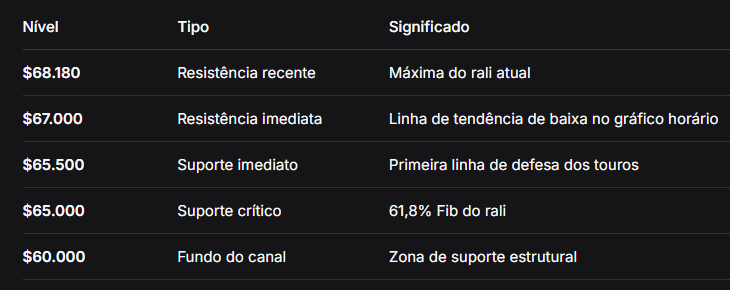
Key Levels to Monitor
📉 2. The Trap Forming: Why Volume is Concerning
The volume dynamics are what raise the most alarms. Despite the impulsive appearance of the rally, trading volume has been consistently decreasing as the price approaches resistance.
Healthy breakouts require increasing participation to confirm strength. Instead, the declining volume suggests that buying pressure may be weakening – a classic precursor to bull trap scenarios.
What is a bull trap?
A bull trap forms when the price briefly breaks above a resistance, attracting buyers who believe in the start of a new rally. The price then reverses sharply and closes below key levels, leaving recent buyers "stuck" in losing positions.
If Bitcoin fails to hold above the channel high and instead falls back into the channel structure, this will signal weakness and confirm the trap setup.
📊 3. The Broader Context: Where We Are in the Cycle
Analyst Benjamin Cowen provides crucial context for understanding the moment. He points out that Bitcoin is closely following the behavioral patterns seen in mid-cycle years – 2014, 2018, and 2022.
The Historical Pattern:
Local bottom formation in February
Relief rally in March
Renewed weakness heading into spring (April/May)
If the historical average holds, Cowen expects Bitcoin to peak in early March at a level about 15% below the year's opening. With the 2026 opening close to $87,000, this places a potential target around $74,000.
The $74,000 zone has technical significance – it acted as important structural support in April 2025. In classic bear market behavior, broken support often turns into resistance.
Cowen warns that a rally to the $70,000-74,000 range should not be interpreted as a confirmed trend reversal. Historically, mid-cycle years produce lower tops that attract capital before prolonged weakness.
🐋 4. The Silent Movement of the Sharks
While retail bleeds, the big players are moving. The Bitcoin market structure reveals a notable shift in capital flows at the beginning of 2026.
What the data shows:
Retail inflows on Binance decreased from about $14.1 billion to $9.05 billion between February 6 and March 2.
This contraction of $5 billion coincides with periods of market cooling, not with aggressive distribution.
On February 25, Bitcoin spot ETFs recorded inflows of about 21,000 BTC (approximately $1.45 billion).
As retail participation weakens, institutional demand begins to reappear. This overlap between declining inflows on exchanges and increasing ETF holdings suggests that capital may be rotating from short-term platforms to long-term institutional custody.
Moreover, the Exchange Whale Ratio rose to 0.64 (the highest since 2015), before retreating to 0.56. This means that the top ten addresses now account for more than 50% of all BTC inflows on exchanges – a concentration that increases the risk of selling pressure.
📈 5. Market Sentiment: Extreme Fear
The Fear and Greed Index remains stuck at "extreme fear," scoring 14 out of 100. This is interesting because, historically, such low levels have preceded reversals – but they can also persist for months.
In prediction markets, traders are assigning a 62% probability that Bitcoin will drop to $55,000 before rising to $84,000. This shows that confidence in an immediate rally is fragile.
Economist Alex Krüger summarized the moment: "Bitcoin @ 78-82 by end of Q1. That's my target. Down here, we are in the land of doubt and fear. Above 71-72 is where FOMO kicks in".
⚠️ 6. Immediate Risks
Risk 1: The Stop-Loss Cascade
Open Interest in Bitcoin futures is near 649,880 BTC (~$43 billion), but has fallen 2.55% in 24h, signaling moderate deleveraging. However, the market structure remains fragile. With concentrated whale inflows, a rotten downward move could sweep stops of long positions and trigger a cascade of liquidations.
Risk 2: The Inflation Ghost
On the macro front, inflation remains resilient. The PPI (Producer Price Index) came in at 2.9%, above expectations of 2.6%. Coupled with geopolitical tensions between the US and Iran, the scenario favors risk aversion.
Risk 3: The Bear Flag
Technically, the 3-day chart shows a formation of a bear flag that threatens a drop of 39% towards $41,400 if support at $62,300 is lost.
What to Expect from the Next Move
Bitcoin's rally remains vulnerable while testing the confluence resistance with declining volume. A rejection from this zone would confirm a potential bull trap and increase the likelihood of a corrective move back to the channel support near $60,000.
Only a strong breakout with volume confirmation would change the outlook decisively to bullish.
For now, the watchword is caution. The macro scenario, technical resistance, and declining volume form a dangerous cocktail for those caught up in the excitement of the rally. The sharks are accumulating, but small fish swimming against the current may end up in the net.
And you, are you buying, selling, or just watching this resistance? Do you think this rally is the start of something bigger or just another trap before the fall? Comment below!