Market Summary: Institutional Support, Emotional Freezing Point, Short Seller Crowd.
Today's market presents a classic picture of severe divergence between institutional and retail investor sentiments. As Iran's Supreme Leader Khamenei confirms his death and the geopolitical uncertainty caused by the power vacuum reaches its peak, institutional funds recorded a violent support of over $460 million through ETF channels, pushing BTC prices to strongly rebound from weekend lows to $68,720.
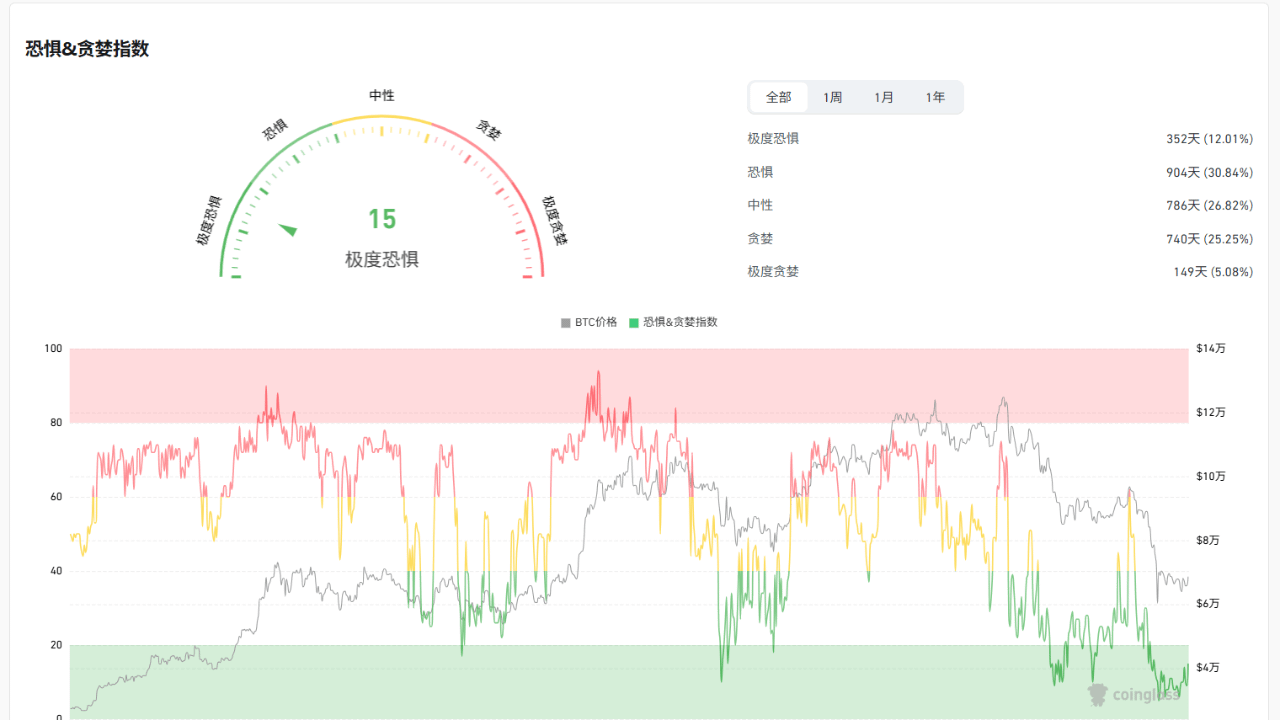
However, the Fear and Greed Index remains at an extreme fear level of 15, showing no signs of warming for several weeks. Meanwhile, macro headwinds are intensifying: Iran has blocked the Strait of Hormuz (which accounts for about 31% of global oil transport), driving up WTI crude oil prices and exacerbating inflation concerns.
The market is holding its breath for the U.S. February non-farm data to be released on March 6 (Friday) (expected only 60,000 new jobs), to determine whether the labor market is cooling. The current market is in intense competition between smart money positioning against the trend and panic money fleeing, with a structural reallocation-driven shift brewing.
1️⃣ ETF fund situation: Institutions are aggressively supporting, with a single-day inflow reaching a recent high.
Data from March 2:
BTC ETF: Net inflow +$458.2 M.
Main contributions: BlackRock IBIT net inflow $263.2M, Fidelity FBTC net inflow $94.8M.
Grayscale GBTC: Outflows have stopped, net inflow $0.0M.
ETH ETF: Net inflow +$38.7M.
Main contributions: BlackRock ETHA net inflow $26.5M.
Against the backdrop of sustained high geopolitical risks and widespread market panic, institutional capital demonstrated a strong support willingness on March 2. A net inflow of over $450 million, especially IBIT's record single-day performance, clearly indicates institutions are utilizing retail panic to counter-trend buy. This is not a short-term action, but a fundamental vote on BTC's long-term value. Meanwhile, ETH ETF also recorded nearly $39 million in inflows, showing that institutions' willingness to allocate mainstream crypto assets has not wavered due to the war.
2️⃣ Sentiment: Index 15, maintaining extreme fear.
Fear and Greed Index: 15.
The index has hovered in the extreme fear zone (at 20) for more than three consecutive weeks. This clearly reflects that retail investors' panic response to geopolitical risks, after experiencing the trauma of previous crashes, has not yet dissipated. The price rebound and the ongoing divergence from a freezing point of sentiment is a typical characteristic of a large bottom or the early stage of a trend, but a complete recovery of sentiment requires more sustained positive fundamentals or time to settle. The divergence between current market sentiment and institutional capital flows suggests that once retail sentiment reverses, it may lead to an explosive market.
3️⃣ Derivatives: Extremely differentiated rates suggest short squeeze potential.
24-hour network liquidation data:
Total liquidation amount: $371 million.
Long liquidation: $250 million, accounting for 67.4%.
Short liquidation: $120 million, accounting for 32.6%.
Main annual rate scan (Binance):
BTC rate: +1.43%.
ETH rate: -10.79%.
SOL rate: -16.56%.
XRP rate: -19.67%.
As much as 67.4% of liquidations came from longs, explaining why prices can plummet rapidly under geopolitical shocks—this is the concentrated retreat of leveraged longs. More concerning is the extreme negative annual rates for ETH, SOL, and XRP. Such deep negative rates imply that short positions are extremely crowded on these assets, with high shorting costs. Any signs of market easing (such as geopolitical de-escalation or continued institutional buying) could trigger concentrated short covering, leading to a violent short squeeze. This combination of long bloodbath + crowded shorts is a typical derivative structure of the market being at a 'panic extreme.'
4️⃣ RSI heat map: Neutral bottoming, no overbought signals.
Top 50 coins by market cap:
Overall atmosphere: RSI average value 44.62, entering the neutral range.
Individual coin technical indicators:
BTC: 44.01 (slightly weak neutral)
ETH: 42.31 (slightly weak neutral)
SOL: 44.04 (slightly weak neutral)
The violent rebound after the geopolitical shock has not pushed short-term technical indicators into the overbought zone (usually >70). RSI is generally in the neutral range of 40-50, indicating that the market is currently in a healthy bottoming or recovery phase, rather than overheating. This leaves ample technical space for further upward movement. The divergence between technical and sentiment (technical neutral vs. sentiment extreme fear) reinforces the judgment that the market is at a critical turning point.
5️⃣ Whales and ammunition: Ample ammunition, Saylor holds on despite losses.
Stablecoin liquidity pool:
USDT market cap: approximately $183.66 billion.
USDC market cap: approximately $76.16 billion.
Total: approximately $259.82 billion, total market cap remains stable.
MicroStrategy (MSTR) position tracking:
Open interest: 720,737 BTC.
Average cost: $75,985.
Estimated unrealized loss: -9.99% (approximately -$5.47 billion).
As the market experiences geopolitical storms and violent rebounds, the total reserves of stablecoins remain stable, especially USDT's market cap rising steadily. This rebuts the panic narrative of significant capital outflow, indicating that a large amount of capital is still on the sidelines, waiting for a clearer entry opportunity. MicroStrategy continues to hold firm despite nearly a 10% unrealized loss, with its founder Michael Saylor announcing on March 1 that he has increased his position by 3,015 BTC (at $67,700 each), providing the market with the most solid psychological and cost anchoring point. This combination of whale holding firm, institutional support, and retail fear constitutes typical elements of the market bottom.
6️⃣ Macroeconomic events: Middle East situation dominates, non-farm data approaching.
Middle East situation:
Power vacuum: Following Khamenei's death, Iran immediately initiated the constitutional succession process, with candidates including his son Mojtaba, loyalist Ali Larijani, and other hardline clerics.
Strait blockade: The Iranian Islamic Revolutionary Guard Corps (IRGC) announced that no vessels will be allowed to pass through the Strait of Hormuz and threatened to ignite any ships attempting to pass. This directly caused WTI crude oil prices to soar from $72.21/barrel before the conflict to $84/barrel and may further rise to $85-90/barrel.
Geopolitical impact: The surge in oil prices exacerbates global inflation concerns, potentially delaying the Federal Reserve's interest rate cuts, posing macro headwinds for the crypto market.
Non-farm data expectations:
Announcement time: March 6 (Friday) 21:30 UTC.
Market expectations: Approximately 60,000 new non-farm jobs (far below January's 130,000), with the unemployment rate expected to slightly rise to 4.3%-4.4%.
Market impact: If the data is as expected, it may exacerbate market concerns about economic slowdown, further strengthening risk aversion; if the data is unexpectedly strong, it may raise expectations for the Federal Reserve to delay interest rate cuts, posing a double blow to risk assets.
💡Future outlook
The market is undergoing an extreme stress test triggered by a geopolitical nuclear bomb. Its characteristics include: institutions aggressively supporting (ETF daily inflow of $458M) + retail sentiment at a freezing point (fear index 15) + extreme leverage structure (shorts crowded) + ample stablecoin ammunition ($259.8 billion) + whales holding firm (Saylor maintains despite losses). This forms a textbook-level 'panic extreme' characteristic.
Key observation points (next 24-48 hours):
Middle East situation follow-up: Focus on the power transition process following Khamenei's death, the duration of the Strait of Hormuz blockade, and any signals of diplomatic contact.
ETF fund flows: Observe whether today's significant inflow is an isolated incident or the start of a continuing trend of institutional buying.
March 6 non-farm data: Actual data will directly influence market expectations for economic prospects and Federal Reserve policy.
BTC key price levels: Whether it can effectively stabilize and break through the $69,000-$70,000 range will determine if the rebound is a technical repair or the beginning of a trend reversal.
Core logic: While everyone's attention is drawn to the panic of war and the noise of rebounds, a silent shift of funds and restructuring is occurring. This harsh washout, akin to a late spring chill, is likely the last and most intense pain before a new round of market activity begins.
Pay attention to the scholar, continuously analyzing the truth behind the data for you! 😘