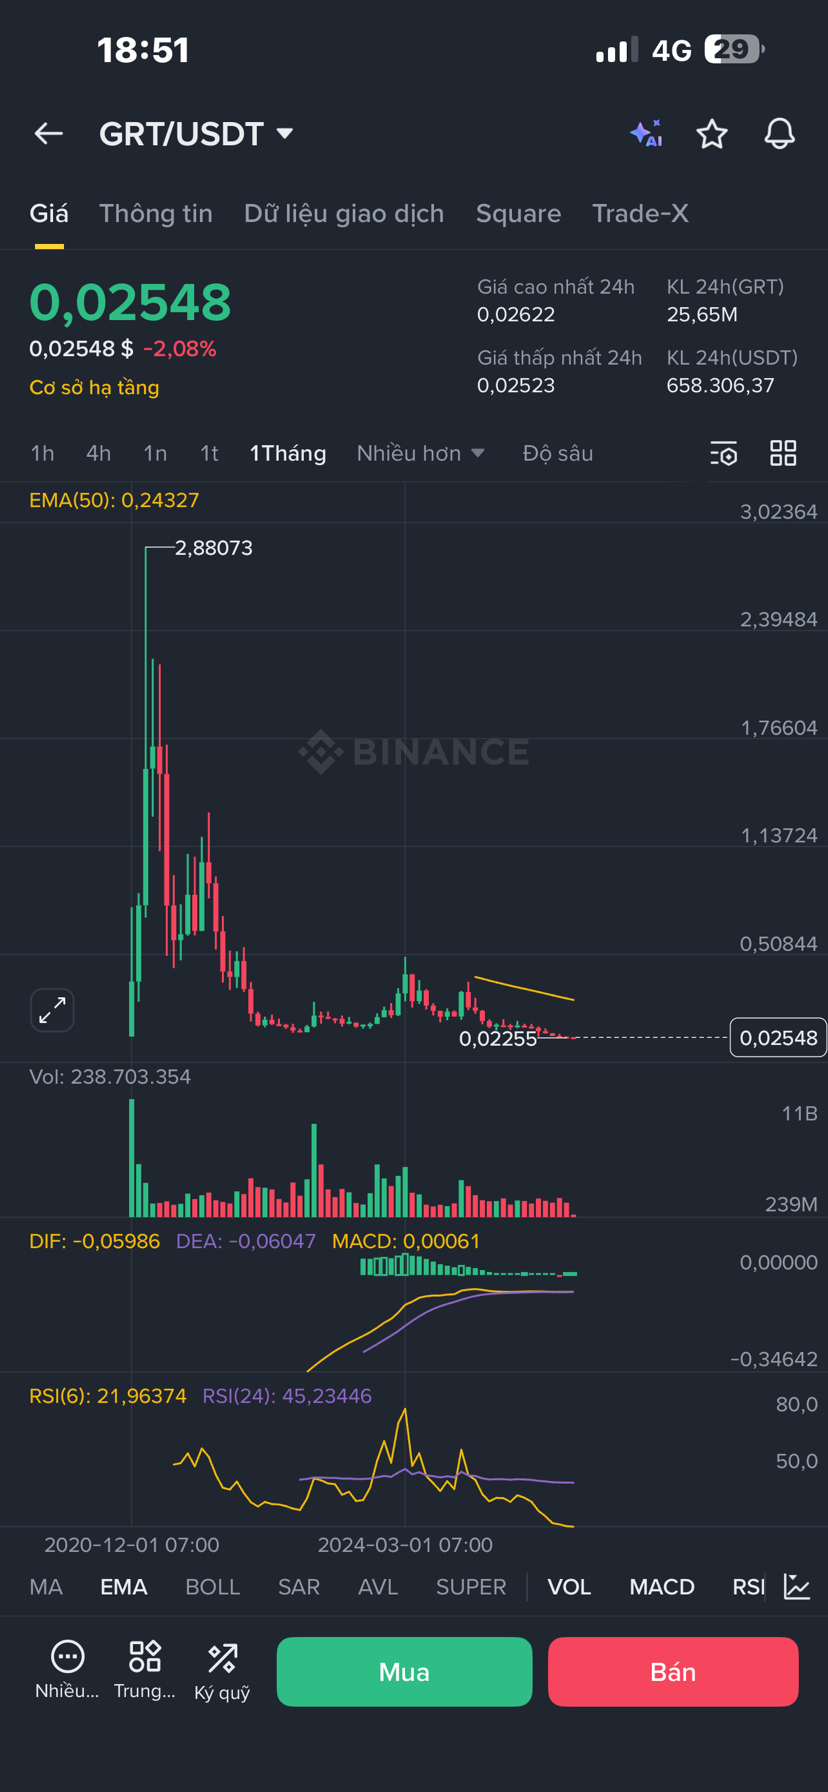
1️⃣ Monthly chart analysis of GRT
Previous cycle peak:
about 2.88$
After that:
downtrend lasting nearly 4 years
Features on the chart:
1. Clear bottom
0.022$
2. Current price
~0.025$
👉 almost at the bottom of the cycle
RSI month
RSI ~22
This is extremely rare.
Previous cycle:
RSI month ~25 → start bull run.
MACD month
MACD is about to cross up.
This is usually a signal:
👉 altcoin cycle reversal
2️⃣ Long-term accumulation area of GRT
Important areas:
0.02-0.03$ this is the cycle
0.03-0.05$ accumulation area
0.08-0.12$ breakout
0.2-0.3$ bull confirmation
The area 0.02-0.04$ is the best long-term accumulation area
3️⃣ Project fundamentals
The Graph is called: Google of blockchain
Function: index blockchain data.
For example:
app
defi
AI agent
want to get blockchain data → use The Graph.
Examples of projects using GRT:
Uniswap
Aave
Decentraland
All use the subgraph of GRT.
4️⃣ The role of GRT in the AI sector
This is the important part.
AI needs to operate:
big data
blockchain data
realtime data
The Graph provides: data indexing layer
For:
AI agent
AI trading bot
AI analytics
For example:
Fetch.ai
Bittensor
all need data layer.
GRT is:
👉 data infrastructure
5️⃣ Why GRT hasn't pumped strongly
There are 3 reasons:
1️⃣ new AI narrative explodes 2024-2025
2️⃣ token unlock many years ago
3️⃣ meme money flow attracts liquidity
But when the market matures:
👉 infra coin will run strong
6️⃣ The actual target of GRT
Moderate bull run: 2 – 3$
Strong bull run: 4 – 6$
Very strong bull run: 8 – 10$
7️⃣ Buying strategy according to BTC
If Bitcoin:
BTC 65k – 70k
gradually buy 0.022 – 0.03
BTC 60k
buy strongly 0.02 – 0.025
BTC > 75k
should not buy anymore just hold.
8️⃣ Conclusion for GRT
Advantages:
✔ important infra base
✔ has dropped 99% from the peak
✔ bottom price area of the cycle
Cons:
⚠ increases slower than meme coin.
👉 If you buy 0.02 – 0.03
Cycle target:
3 – 6$
that is x100 – x200 from the bottom.
💡 But there is one very interesting thing:
The monthly chart of **The Graph is currently almost 90% similar to the chart of Solana in 2020 before it x200.
If this cycle is correct, GRT could explode much more than many think.