 $BTC is currently sitting in the middle of a very interesting liquidity landscape.
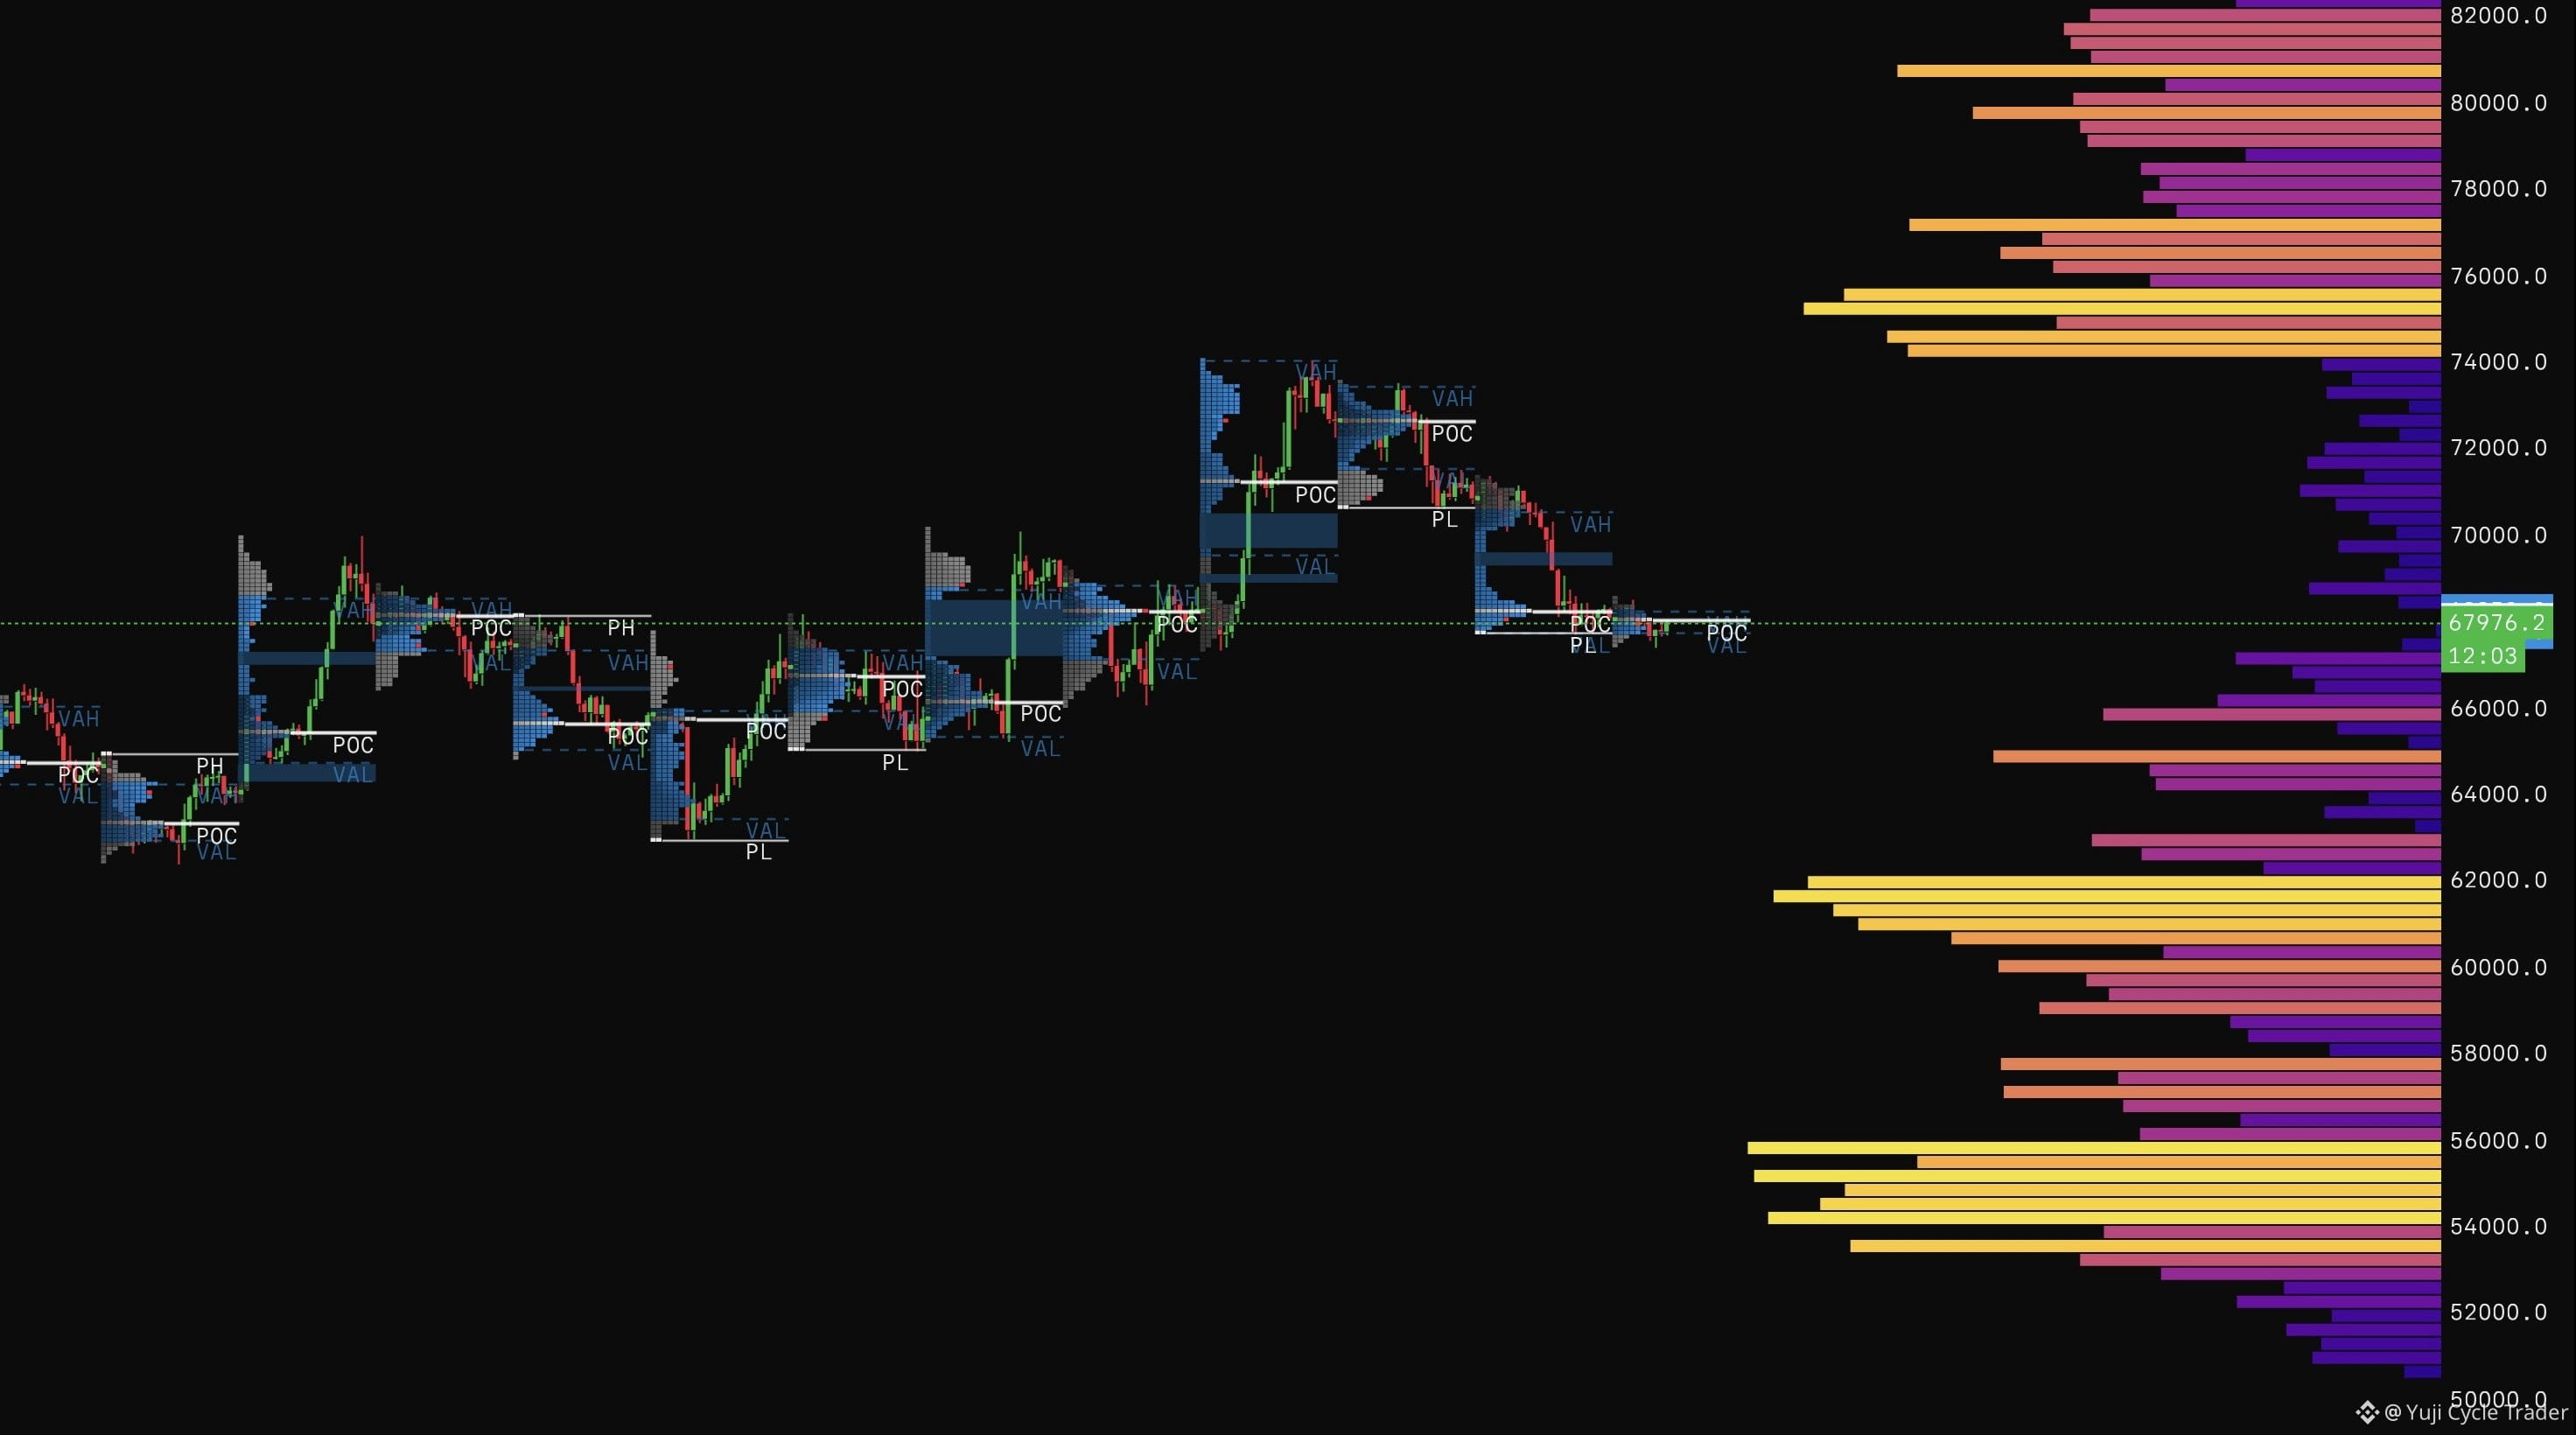
When looking at the recent liquidation map, it becomes clear that the market is surrounded by clusters of leverage on both sides. These zones are more than just price levels — they represent areas where a large number of positions could be forced to close if price moves aggressively enough.
Below the current price, the most significant liquidation pocket stretches roughly from 62,200 USD down to around 54,000 USD. This area appears heavily populated with leveraged long positions. When liquidity gathers like this, it often acts as a magnet because markets naturally gravitate toward zones where forced liquidations can occur.
From a structural standpoint, that lower band represents a deep liquidity pool where a strong downward move could trigger cascading liquidations. If selling pressure begins to accelerate, that entire region could become a path where the market rapidly clears positions.
On the opposite side, there is another notable liquidity cluster above the market. Starting near 74,000 USD and extending toward the 81,000 USD region, this zone contains a concentration of short exposure. If Bitcoin manages to break through nearby resistance levels with momentum, those positions could begin unwinding, potentially creating a sharp upward squeeze.
Right now, price action is struggling around the POC area on the 1-hour profile. This point of control typically represents a temporary balance between buyers and sellers. Markets often pause here before deciding which side of the liquidity landscape they want to explore next.
If buyers manage to regain strength from this equilibrium zone, the first areas worth watching would be around 69.4K and then 70.6K. Both of these levels align with important TPO regions where the market previously spent significant time trading, making them natural checkpoints for price.
Psychologically, this is the type of environment where traders become split in their expectations. Some anticipate a sweep of the large long liquidation cluster below, while others watch for the possibility of a squeeze through overhead resistance.
In markets dominated by leverage, the next move is often less about direction and more about where the largest pocket of liquidity sits.
So the key question becomes: will $BTC be drawn down toward the heavy liquidation zone below, or will the market surprise participants and instead expand upward into the short cluster above?
