Ethereum Technical Analysis and Trading Strategy on September 20, 2025
Technical Analysis
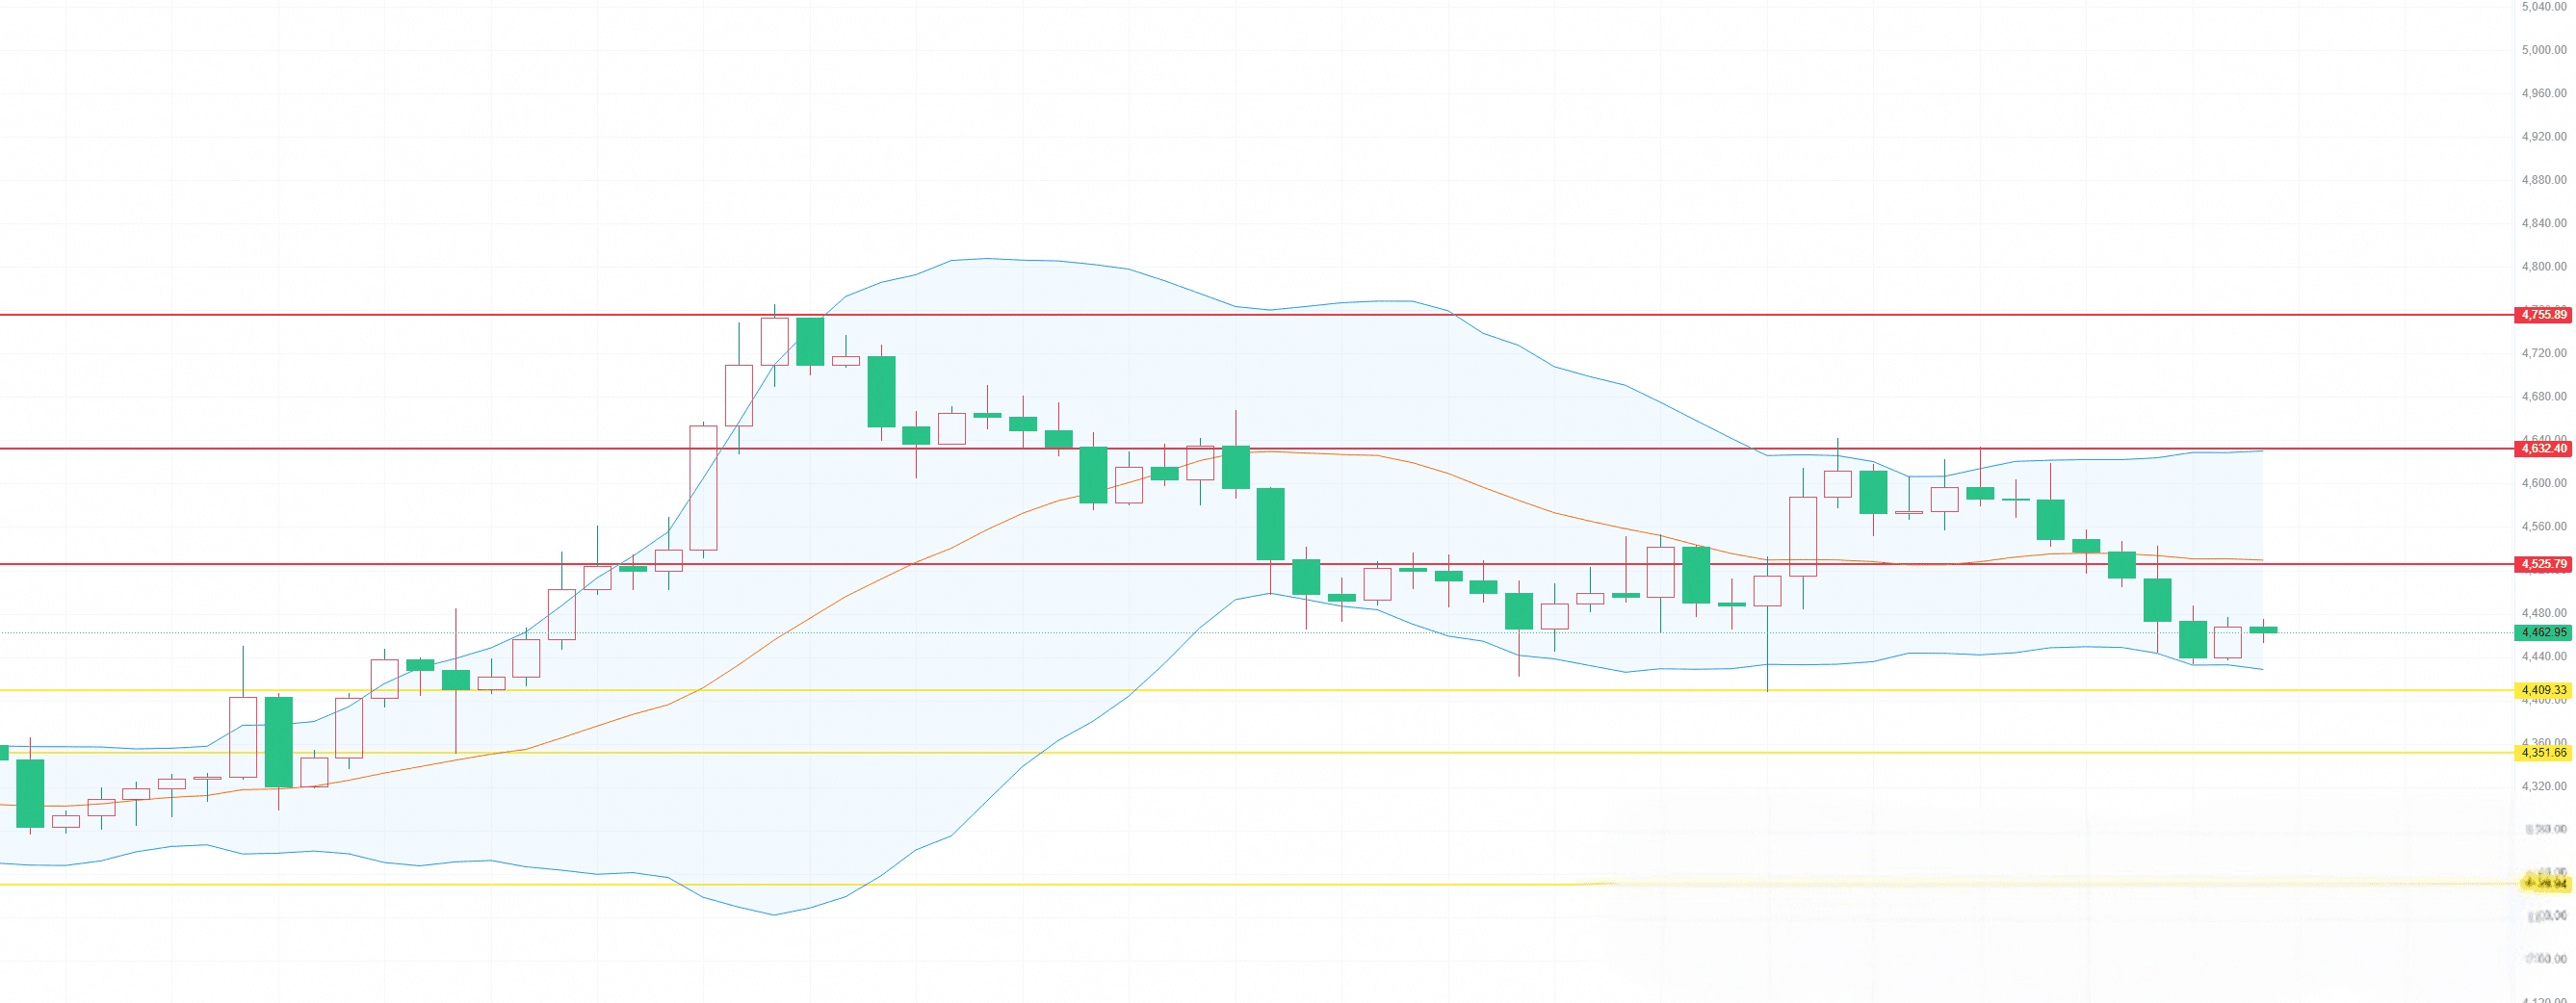
1. Bollinger Bands Indicator: From the 4-hour chart, Ethereum is currently in the rebound phase after hitting the lower Bollinger Band, but the rebound strength is weak and has not yet attempted to touch the middle band resistance. Currently, the Bollinger Bands are opening, and the middle band is declining, which usually corresponds to a downtrend in the market. The current prices corresponding to the three lines of the Bollinger Bands are 4428 (lower band), 4529 (middle band), and 4630 (upper band). If it can stabilize above the lower band, it may attempt to test the middle band resistance; conversely, if it cannot stabilize above the lower band, the market may accelerate its decline.
2. MA moving average indicator: In the 4-hour chart, the short-term MA moving average indicator has formed a death cross and is currently showing a parallel trend. ETH is currently operating below the 5-day moving average, which corresponds to a market decline. Meanwhile, in the hourly chart, after the short-term moving average death cross, it has entered a parallel state, while bullish momentum is beginning to emerge. Currently, the market is operating between the 5-day and 10-day moving averages, and a period of fluctuation is expected to determine the subsequent direction.
3. MACD indicator: In the hourly chart, the MACD indicator is below the zero line and is moving forward before a compound crossover, currently showing an upward trend with a golden cross, and bullish momentum is starting to increase. In the 4-hour chart, the MACD indicator is trending down below the zero line with a dual line crossing below the zero line, currently moving parallel below the zero line, and bearish momentum is gradually increasing.
4. RSI indicator: The current RSI indicator is in the oversold phase, corresponding to the values of 11.8 - 6.3, currently showing a golden cross upward, indicating a potential upward fluctuation in the market. However, it is important to note that if this indicator continues to decline, it may also lead to an accelerated market downturn.
Comprehensive conclusion
Based on the analysis of various technical indicators, the Ethereum market is currently in a sideways fluctuation state.
Resistance and support levels
1. Resistance levels: 4530, 4630, 4750
2. Support levels: 4400, 4350, 4230
Operational strategy
High short strategy: Establish a short position near 4530. If the market continues to rise, the replenishment point is set at 4630. If the price breaks and stabilizes above 4750, then stop loss and exit. The target profit-taking points are divided into two, the first profit-taking point is 4400, and the second profit-taking point is 4360.
Low long strategy: Establish a long position near 4400. If the market continues to fall, the replenishment point is set at 4350. If the price breaks and stabilizes below 4230, then stop loss and exit. The target profit-taking points are similarly divided into two, the first profit-taking point is 4520, and the second profit-taking point is 4620.
The cryptocurrency market is not a cash machine, but a place for the redistribution of wealth. Only by respecting the market, adhering to the rules, and investing rationally can one move steadily forward in this challenging field, achieving the preservation and appreciation of wealth.
Do not let greed cloud your vision, and do not let fear control your steps. In the parallel world built on blockchain, true travelers do not chase trends but forge their own compass. May you set out with a clear understanding, accumulating wisdom in the ups and downs, ensuring that every step of exploration leads to a more rational self.