From a structural perspective, the chart is beginning to resemble patterns that have appeared before sharp market declines. These setups don’t appear frequently, but when they do, they often precede a period where volatility expands quickly and the market searches for deeper liquidity.
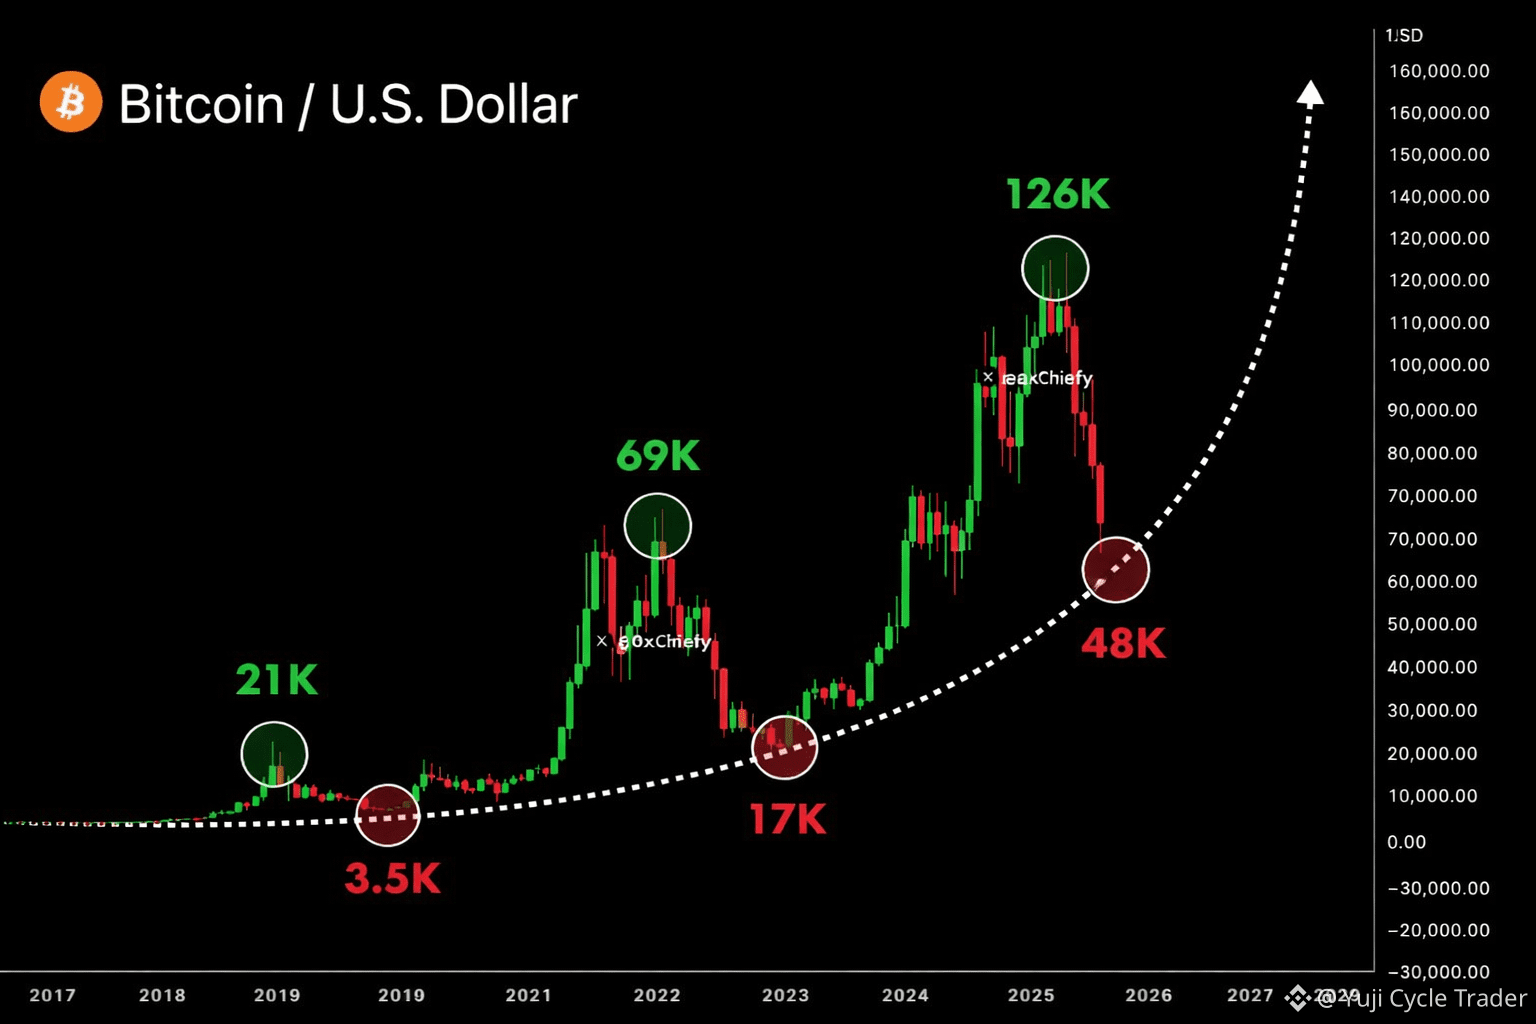
If this structure continues unfolding in the same way, one possible path is a move toward the 48,000 USD region in the coming period. That level is not just a random number — it represents a deeper liquidity zone where the market previously found balance during earlier phases.
In environments like this, the market often behaves in a way that challenges the majority’s expectations. When price still holds certain short-term supports, many participants interpret the movement as temporary noise — a shakeout or a routine correction before continuation.
But structure sometimes tells a different story.
Liquidity dynamics suggest that if current support areas begin to weaken and selling pressure expands, the market could quickly search for the next pocket of demand. In leveraged markets like crypto, once key levels give way, price often accelerates toward the next major liquidity zone rather than moving slowly.
Psychologically, this is where risk becomes underestimated. When traders are convinced that the bottom has already formed, defensive positioning tends to decrease. If the market then moves sharply in the opposite direction, sentiment can shift very quickly from confidence to panic.
That’s why the current phase requires caution rather than conviction.
Whether this deeper scenario unfolds or not, preparing for multiple outcomes is always more important than assuming a single direction. Markets rarely move in ways that feel comfortable for the majority — and the largest losses often occur when traders simply believe a large move “cannot happen.”
For now, the focus remains on how $BTC behaves around its current support structure and whether selling pressure continues to expand toward deeper liquidity zones.