Hello, community! After that insane roller coaster that took the $MIRA to 0.1500 and the strong correction that followed, many people are wondering: is the hype over or is it time to fill the cart again? Let's analyze the cold hard data from the 4-hour chart! 📊
🔍 Graphic Analysis (The "Why"):
Looking at the 4H chart, we see that after the sharp drop, the price found solid support in the region of 0.0766 and is now consolidating.
What catches attention now are the indicators:
StochRSI: The lines crossed up strongly (63.96 against 39.72), indicating that the short-term momentum is turning towards the bulls.
RSI: It is neutral around 49, which means there is plenty of room for the price to rise before becoming 'overbought'.
Bollinger Bands: The price is squeezed below the central band (0.0843). If it can break this middle line, the path is clear to seek the top of the band. The MACD has also stopped falling and is practically zero, showing exhaustion of selling strength.
🎯 Entry and Exit Points (Trade Setup):
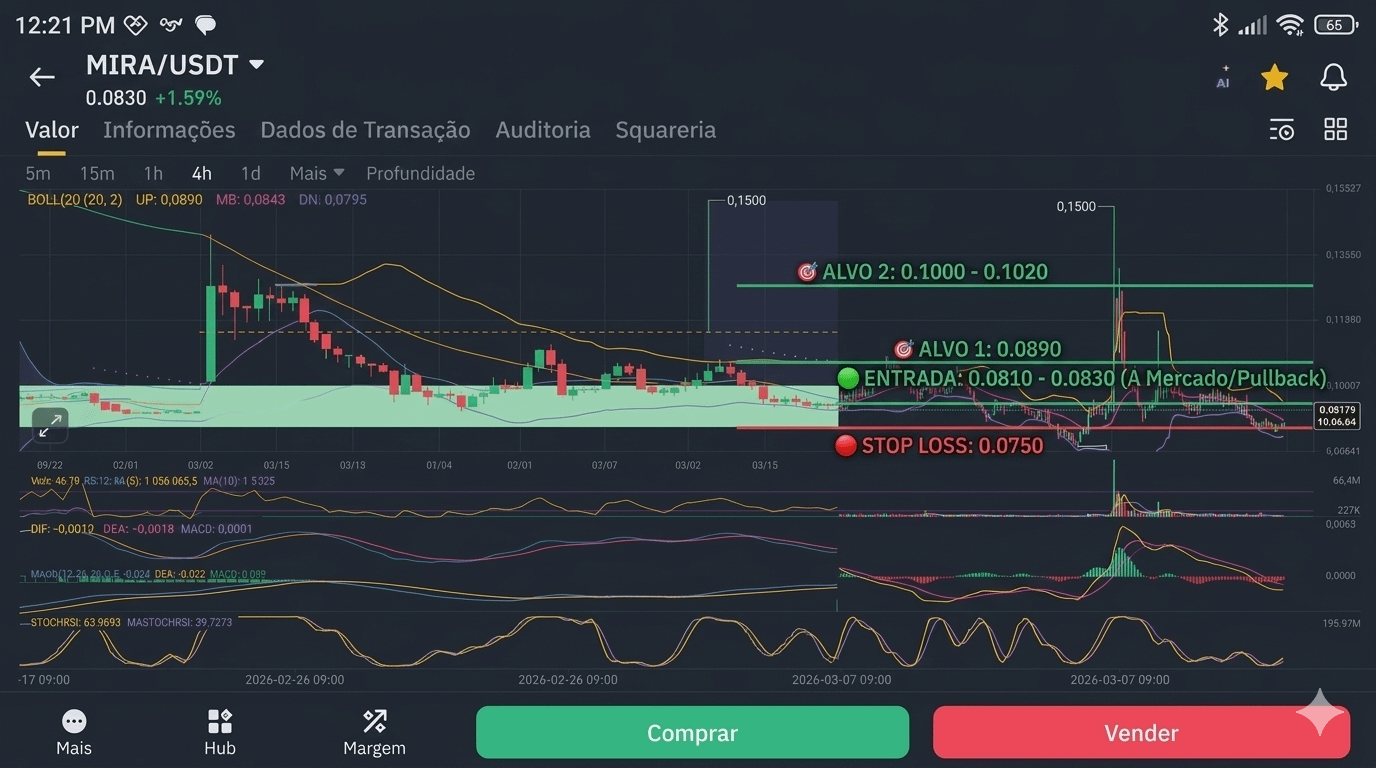
🟢 Entry Zone: The current price at 0.0830 already allows for a light entry for those who don't want to miss out, but the ideal zone to build the position would be between 0.0810 to 0.0830, taking the small pullbacks and leveraging the support that formed below this range.
🔴 Stop Loss (Protection!): The safe point here is below the last strong low. I suggest the Stop Loss at 0.0750. The reason is simple: if the price loses the recent low of 0.0766 with strength and closes the 4H candle below it, the reversal scenario falls apart and the MIRA seeks much deeper supports.
🎯 Targets (Take Profit):
Target 1: 0.0890 (Top of the 4H Bollinger Band and immediate short-term resistance).
Target 2: 0.1000 to 0.1020 (Psychological market resistance and the last relevant low before free fall. This is where many people will want to sell).
🤔 Is it a true reversal or will it hit the ceiling and drop again?
Cold analysis tells us: the price of $MIRA dropped significantly after hitting the peak and is now catching its breath. The StochRSI is very favorable for a stretch up to 0.0890. However, for us to believe in a real upward reversal (and a return to 0.1500), the MIRA needs not only to reach the mark of 0.1000 but to break it with consistent volume on the daily chart.
Until then, we are operating within a consolidation box. Ride the wave, but protect profits along the way and drag the Stop Loss up as soon as the operation turns positive! 🛡️
What do you think? Is it time to buy on the MIRA or do you prefer to stay out? Leave a comment! 👇💬