Bitcoin $BTC is back in the spotlight! On Tuesday, the market was shaken by a wave of short position liquidations totaling $186 million. Against the backdrop of geopolitical tension and comments from Donald Trump, the price held above the psychological mark of $70,000.
📊 Liquidity analysis: Where do we go from here?
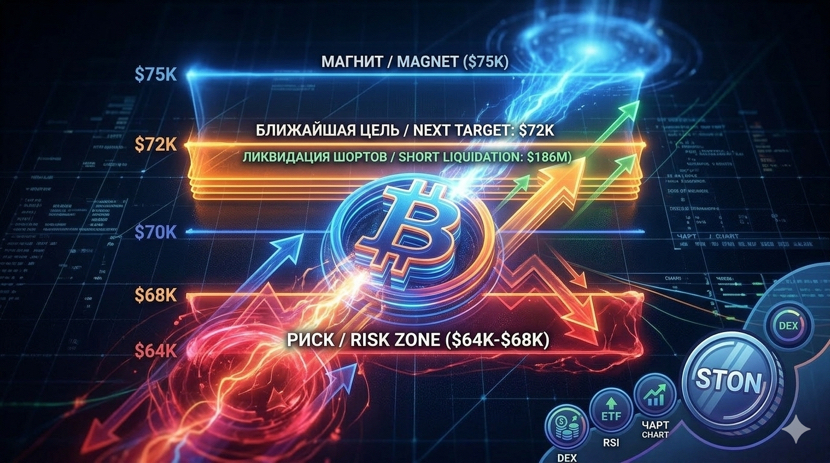
The current situation on the charts resembles the calm before the storm. Here are the key figures:
The nearest target: Zone $72,000. Here, liquidity is quite 'thin,' allowing the price to quickly pass through this range.
Global magnet: The largest cluster of liquidations is at the level of $74,000–$75,000 (according to CoinGlass).
Risks: Despite the rise, there is four times more liquidity accumulated below (range $64,000–$68,000). Analysts warn: after breaching $72K, a sharp pullback to 'collect' lower orders is possible.
📈 Fundamental indicators
1. Institutional demand:
Inflows into ETFs have accelerated to $934 million. Traditional finance continues to choose BTC over gold.
2. RSI momentum: The Relative Strength Index has risen from 30 to 52, confirming the return of buyers.
3. Spot volumes: Trading activity on exchanges has increased by more than 140% in recent days.
💡 While capital flows from gold to BTC, experienced players are seeking returns not only in mainstream assets but also in rapidly growing ecosystems. For example, against the backdrop of BTC volatility, many are reallocating some liquidity to promising DEX protocols. The TON ecosystem is currently leading. STON.fi where interesting farming opportunities can be found, while the market decides the fate of Bitcoin.
Result:
Bitcoin shows strength, but 'heavy' liquidity below forces caution. A breakout at $72,000 could trigger both a rise to $75K and a deep correction.