If you have ever opened a cryptocurrency chart on Binance, you have surely seen green and red bars going up and down.
These bars are called Japanese candles.
And understanding them is one of the most important skills for any trader.
Because each candle tells the story of what happened in the market.
🕯️ What are Japanese candles?
Japanese candles are a way to show how the price of an asset moved over a period of time.
That period can be:
• 1 minute
• 5 minutes
• 1 hour
• 1 day
• 1 week
Each candle represents the battle between buyers and sellers during that time.
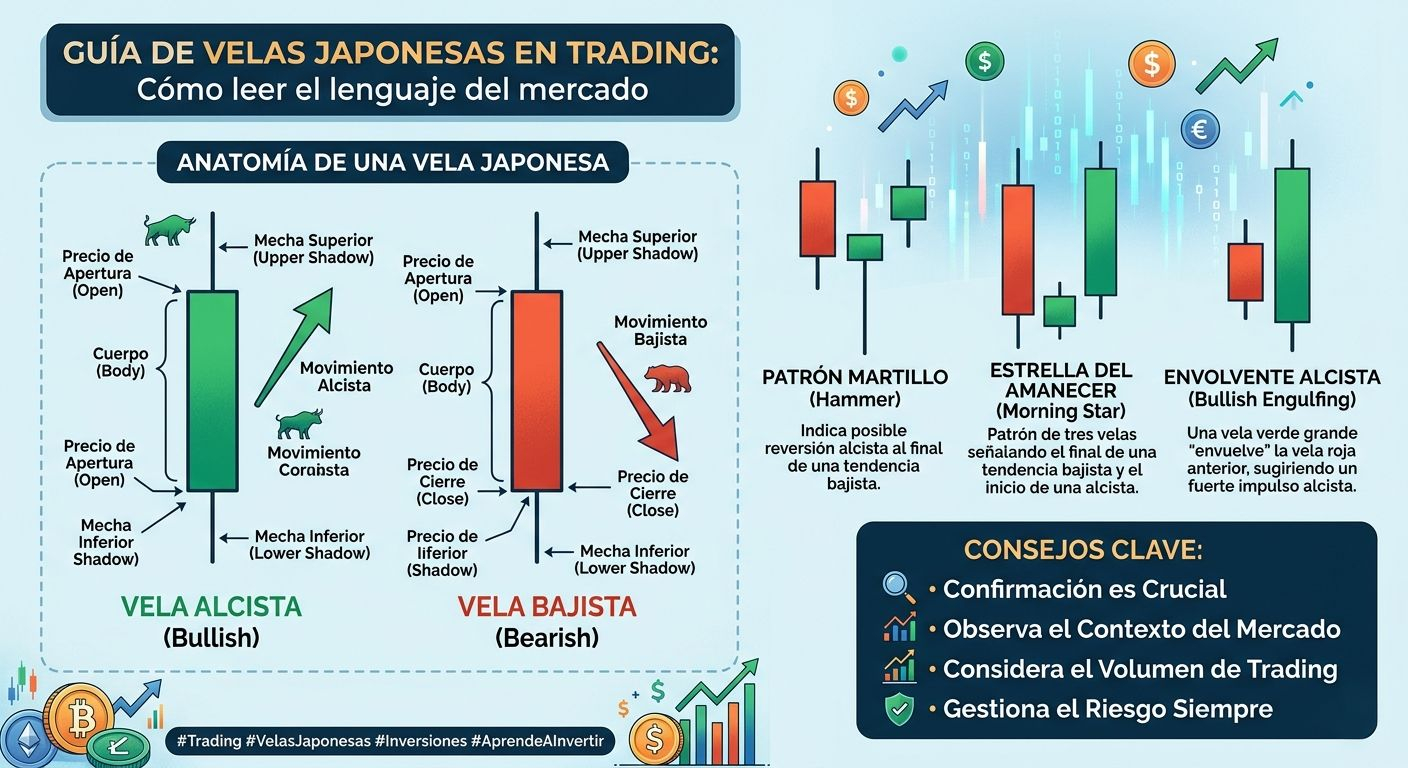
📊 The 4 parts of a candle
Each candle has four key data points:
1️⃣ Open
The price where the period started.
2️⃣ Close
The price where it ended.
3️⃣ High
The highest price reached.
4️⃣ Low
The lowest price reached.
These four data points show everything that happened during that trading period.
🟢 Bullish candles (green)
A green candle means that the price went up during that period.
That is:
The closing price was higher than the opening price.
This indicates that buyers were stronger.
🔴 Bearish candles (red)
A red candle means that the price went down.
That is:
The closing price was lower than the opening price.
This indicates that sellers dominated the market.
📉 The wicks or shadows
The thin lines coming out of the candle are called shadows or wicks.
These show how far the price went before retracing.
A long wick can mean:
• price rejection
• buying or selling pressure
• possible trend change
🧠 What the candles really tell us
Japanese candles do not only show prices…
also show market psychology.
For example:
📈 many consecutive green candles
➡️ strong buying pressure
📉 many consecutive red candles
➡️ selling pressure
Long wicks at the top
➡️ rejection at high prices
Long wicks down
➡️ buyers defending the price
⚡ Important candle patterns
Traders also observe candle patterns.
Some of the most known are:
📌 Doji
Opening and closing almost equal.
Indicates indecision in the market.
📌 Hammer
Long wick down.
It can indicate a possible rebound.
📌 Engulfing
A large candle that completely covers the previous one.
It can signal a trend change.
💡 Something important that many beginners do not know
Japanese candles should not be analyzed alone.
Professional traders also use:
• supports and resistances
• volume
• market trend
Because a single candle does not tell the whole story.
🚀 Conclusion
Japanese candles are like the language of the market.
Learning to read them allows you to understand:
• who has control (buyers or sellers)
• when the market may change direction
• where there may be trading opportunities
That's why almost all traders who trade assets like Bitcoin use this type of chart.