Looking at the liquidation Heatmap of the BTC/USDT pair on Binance, we can clearly see 3 huge "pockets" that market makers are targeting:
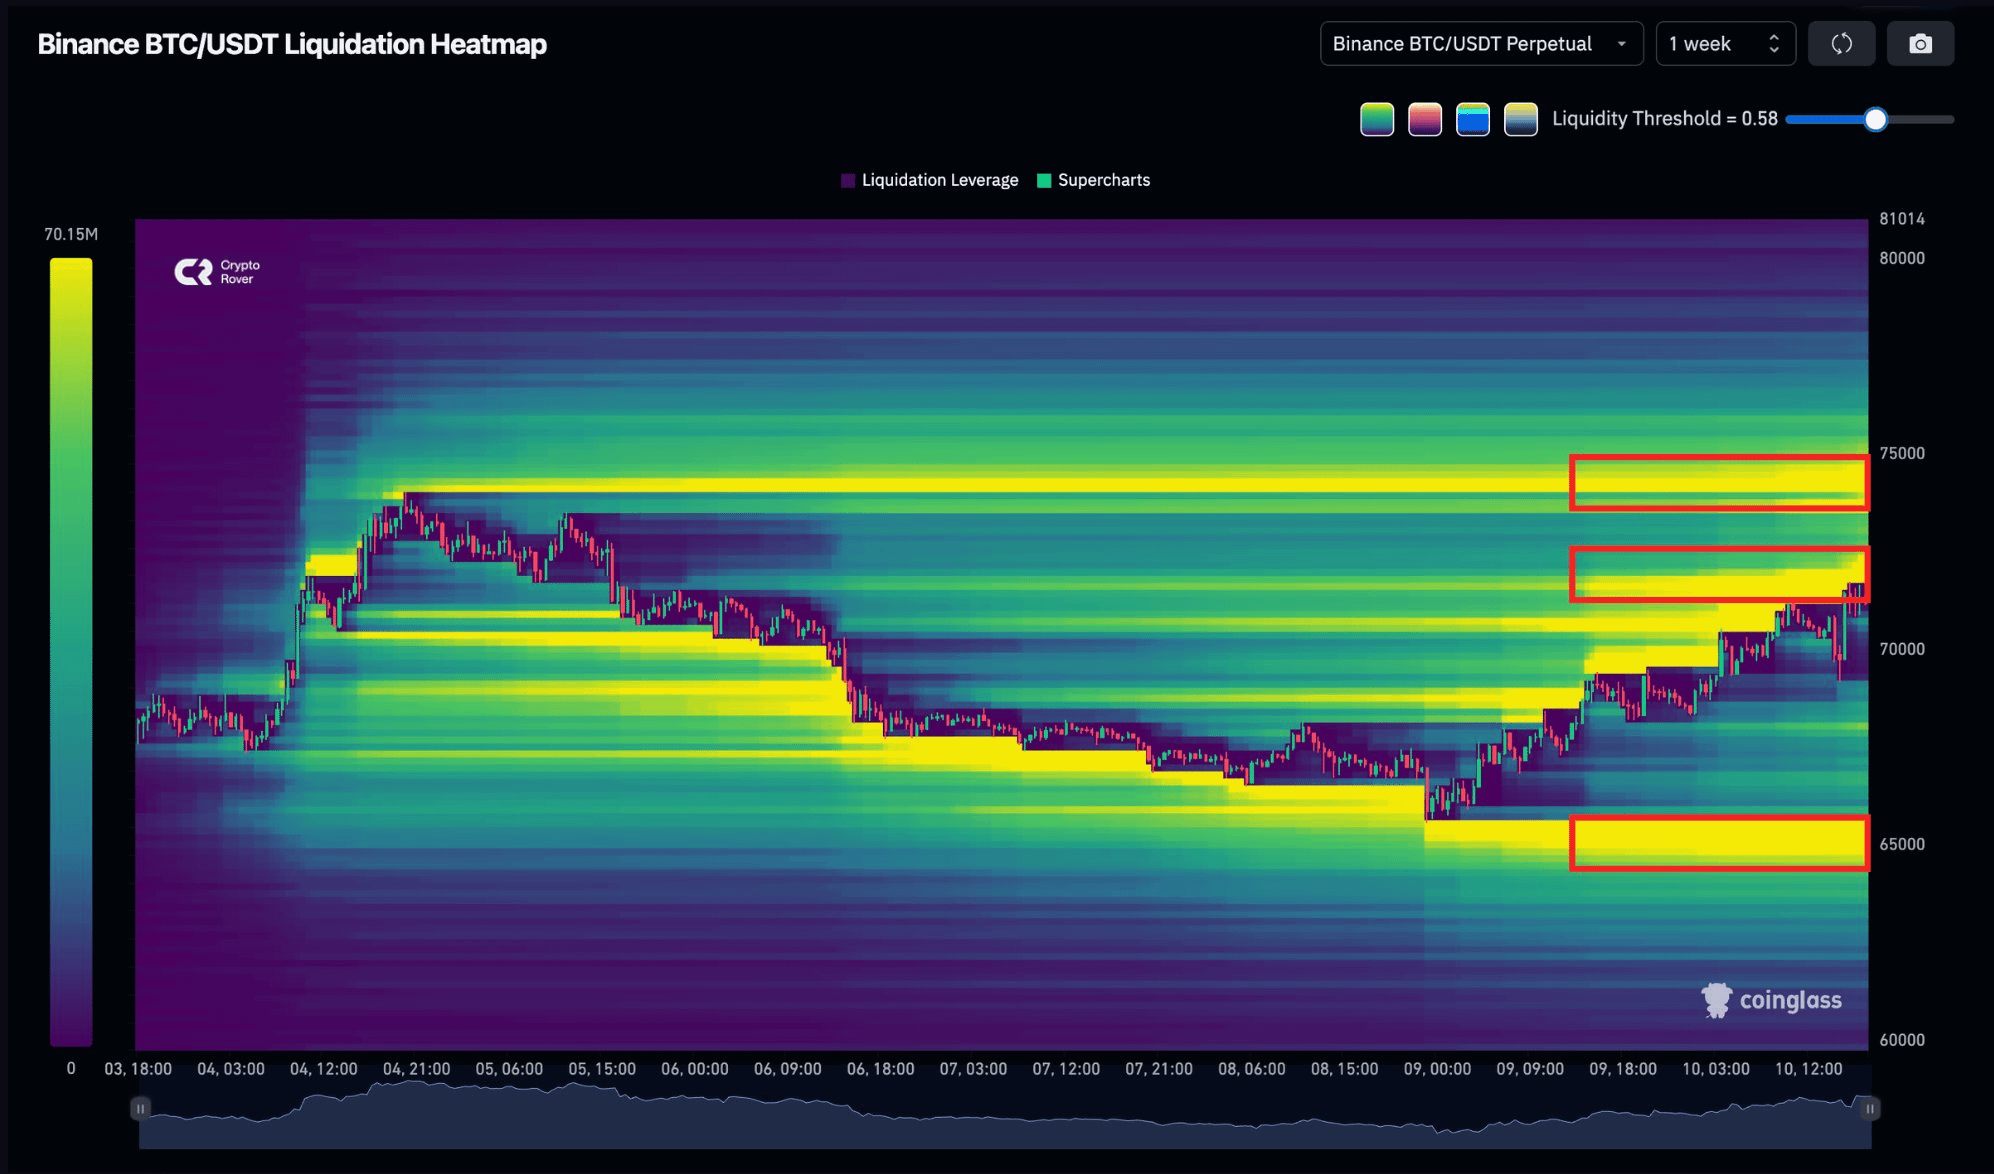
1. Zone $74,000 - $75,000 (Above):
This is the densest Short liquidation cluster. If Bitcoin pushes up here, the short positions will be forced to close en masse, creating a very strong Short Squeeze. This is the giant magnet attracting price upwards.
2. Area $72,000 - $73,000 (Nearby stop):
The price is fluctuating right at this threshold. Clearing out the Short cluster here is often a "necessary stepping stone" before the Bulls launch a full attack to new highs.
3. Area $65,000 - $66,000 (Below):
Where high-leverage Long orders are concentrated. Don't be complacent! Before the surge, sharks really like to make quick "dips" here to clear out Long positions before pushing the price up. This will be an extremely reliable liquidity support area for those looking to catch the bottom.
💡 Strategy for you:
Scenario 1: If the price closes firmly above $73,000, the likelihood is high that it will shoot straight to $75,000. You may consider going Long following the breakout.
Scenario 2: If there is a quick drop to $65,000, this is a "golden" opportunity to accumulate before the next wave of increase.
Note: The heatmap is a liquidity map, not a holy grail. Please manage your capital tightly and set your Stoploss properly!
#LiquidationHeatmap #BinanceSquare #TradingSignal


