
🧐All trading can be simplified; next, I will clarify the logic step by step, combining the practical techniques I have used so far to guide newcomers into the trading market gradually.
This part of the article will be updated with more than one piece; this is the first article in the series. Welcome to search for 【Newcomer Orientation】 on my homepage. The next update will be after reaching 1000 fans; please follow. (In the future, every time I reach a milestone in fan count, I will update a session on trading technology 'Burning Decision,' welcome to follow.)
First, determine one thing: every time I have something to emphasize, I will mark it with an underline. In trading, you can gradually understand its meaning.
🤔 There are actually only three control factors for opening positions—only by slowly handling all factors can one hold good trades with ease.
1️⃣ The first priority is the entry position and timing. A favorable entry point is very beneficial for the holding position.
When traders enter positions at favorable entry points, the price often reverses directly, and the account can immediately generate floating profits. Conservative holders can immediately push for breakeven, making the trader's position mindset more relaxed.
‼️ The focus of this article in the entire series is to first explain the judgment of the opening position.
However, let me finish some benchmark concepts related to subsequent articles in this article. It may be a bit dry, but if you can understand it earlier in trading, it will definitely be a good thing 🤠
2️⃣ The second point is to recognize the trend and determine the stop loss—unlike what you see in other places, the importance of the entry point is higher than that of setting the stop loss.
Because the most important thing for traders is their mindset. When you open a position at a poor entry point and set a stop loss, it may lead to the price hitting your position exactly, and then immediately developing as you originally anticipated. This greatly affects the mindset and can lead to distorted operations, ultimately resulting in liquidation.
Once the number of followers reaches the next stage, after the new article updates, one can understand the meaning more clearly.
3️⃣ The third point is the last point, regarding take profit and compound interest—once there are profits, this part comes naturally, hence it ranks third.
The outline is set... but before starting the article, I want to emphasize a few more things...

Regarding technical trading, or the reasons why chart trading is feasible:
➡️‼️ Short-term trading is gambling‼️: It must be acknowledged that all short-term trading is a gamble 🎲. Traders are betting that at a specific point in time, the probability of winning in one direction is better than the other.
➡️ Most chart trading tutorials on the market are effective: there are basically no incorrect trading techniques, only those that do not suit your operational character. Some people see trends more clearly, while others are better at timing, which is related to personality. Find a trading strategy that allows you to make money and stick to trading one strategy (do not change it frequently; mixing multiple trading strategies will not improve the strategy).
➡️ Chart trading is only used for short-term trading: The consensus view must be that all short-term trades do not consider the actual value of the underlying asset (no fundamental considerations). We only consider the liquidity, gameability, and volatility of the underlying asset. As long as these three points are met, chart trading can be used for short-term analysis.
➡️ Liquidity: This refers to the consensus level regarding the selected trading asset. Taking Bitcoin as an example, when the market reaches a consensus on the decentralized value of Bitcoin (when the market is willing to accumulate Bitcoin with real money), Bitcoin will gain liquidity appreciation from the market. Only when liquidity accumulates to a certain extent can technical trading on charts be established; this rule is a prerequisite.
➡️ Gameability: This means the selected asset must have participatory gaming value. From the perspective of game theory: a trader in the game must avoid falling into disadvantageous games and zero-sum games. For example, if a major player manipulates most of the market chips, when the chips of the underlying asset are essentially controlled by a group with great synergy, other participants face a black box market and become disadvantaged, making technical chart trading lose its guiding significance. Another example: In the A-share market, only long positions can be taken, leaving only holders as the organization, and the only selectable operations are to exit or stay, with no balance constraints on past holders, forming a zero-sum game, which also cannot utilize technical chart trading; this rule is core.
➡️ Volatility: Short-term trading only trades volatility; the price has no value in technical chart trading. You just need to react to volatility; only assets with volatility need trading. Long-term sideways movement will lead to continuous loss of time value in trading. If you cannot trade volatility, there is no need to analyze chart trading... this rule is an important feature.

Now we start the main article, understanding the discount zone and transaction area (taking the bullish direction as an example; the bearish direction is the opposite)
Discount zone
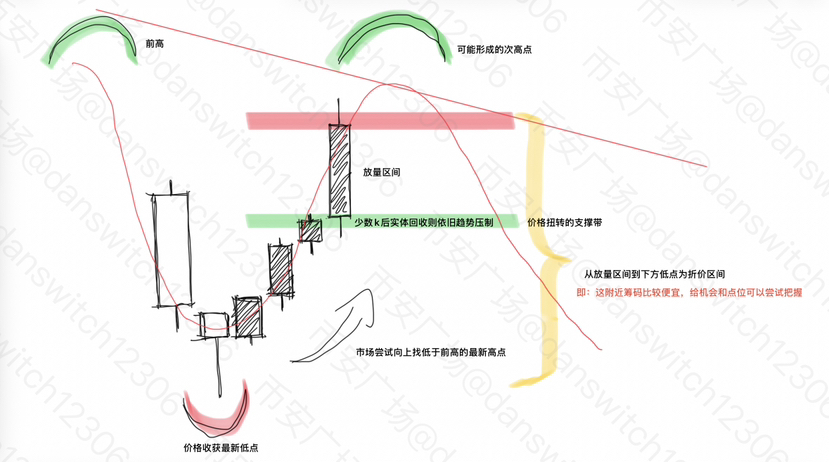
First chart: If we consider participating in a bullish structure, the best entry point is to participate in a reversal structure during a downtrend in a certain cycle.
All advantageous points must be within a certain cycle's trend reversal structure, depending on which cycles you choose—used to handle short-term cycles. I personally often use 15 minutes, 1 hour, and 4 hours. You can also choose your own trading cycle, which relates to the amount of capital; just get used to it, there is not much difference in practice.
A downtrend must produce lower lows and lower highs for the trend to continue—this is a common piece of advice mentioned in most tutorials: because it's just an objective fact.
The key is when you need to participate in this downward trend. The discount zone is defined for this situation—this price range is 'discounted', making it more suitable for buying than other positions.
👀 From this chart, you can see that during a pullback in a downtrend, the market suddenly produced a significant upward volume increase, leading to a huge bullish candlestick, indicating that the market’s main force had a certain buying desire during this pullback—a reminder to market observers 🔔
After this pattern appears for the first time, the price often continues to rise, making a new secondary high, and then pulls back.
During this pullback period, it will enter the discount zone—from the top of the volume bullish candlestick to the latest previous low closing position. Within this range, there are participation opportunities: stop loss is controllable, take profit is optimistic, and positions within the range can react anytime for both long and short.
After a pullback, we can consider starting to participate in the structural reversal of this segment, to end the downward trend of this structure, following the 'big players' and 'smart money' to push the price up.
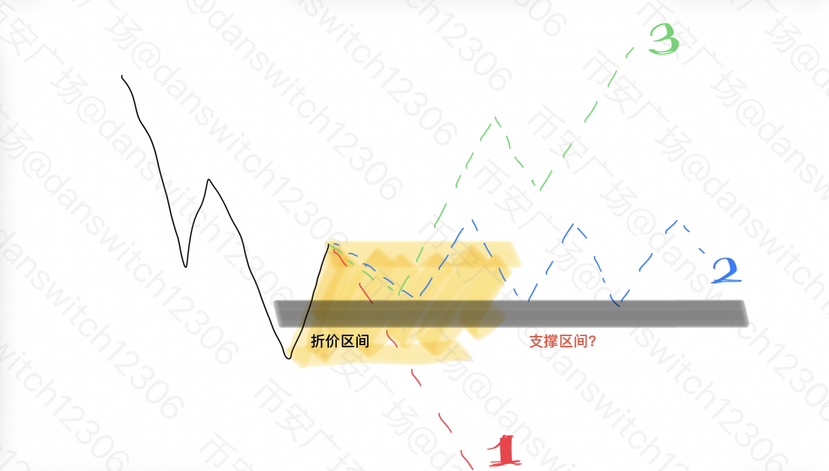
In the second chart, you can see 👀 that after entering the discount zone, the price has three limited possibilities.
As we mentioned earlier, within the discount zone, the actual success probability of opening a position increases. Among the three possibilities, the probability of actual loss is limited by the rules to only one direction, while the actual losses in the other two directions are controllable—breakeven can be pushed at any time.
Then the question comes to the last step: how to determine this support point?
Transaction area
This is very critical. Look closely at the third chart and try to backtrack in the market charts to feel... find the feel for opening positions.

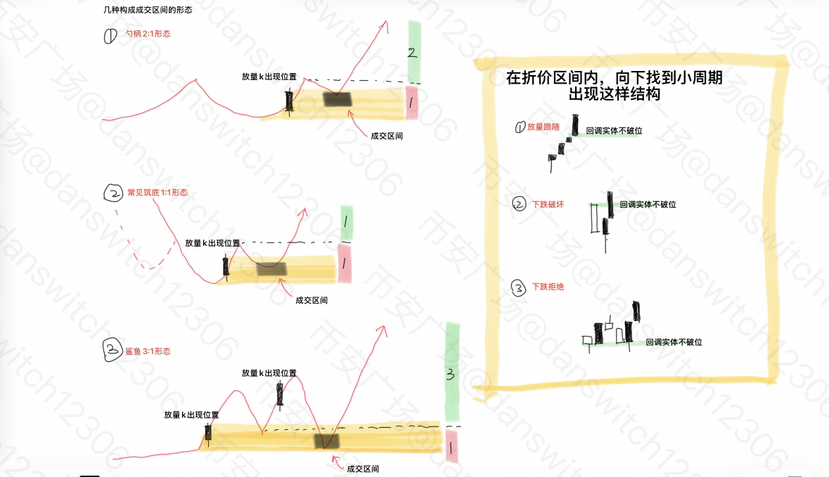
From the lower level cycle of the cycle you selected, find the several small 'patterns' shown on the right side of the third chart, each pattern can be immediately participated in after confirmation, with controllable stop loss downward and considerable take profit upward.
Next, I will introduce several easily observable patterns that can be participated in (left side of the figure):
1️⃣ Spoon handle
The price is oscillating in a major bottom range, and this pattern can be observed at an intermediate level.
The performance is as follows:
Stage One: The price gradually increases in volume, and after the last volume increase, the main force distributes at a strong resistance zone.
Stage Two: Downward volume increases, the price gradually levels off, forming a 'round bottom', followed by a gentle increase in volume.
Stage Three: The price gradually increases in volume, showing a huge bullish candlestick, forming a discount zone, and the price reaches the previous high level.
Stage Four (Participation Stage): The price reaches a small cyclical trading structure within the discount zone, gaining support and rising upwards, with a risk-reward ratio of approximately 2:1 as shown in the figure.
2️⃣ Triple bottom or double bottom
It often appears during one-sided oscillating markets, and once stabilized, it becomes a reversal structure.
The location of the volume candlestick is shown in the figure, finding the transaction area within the discount zone, with a risk-reward ratio shown in the range of 1:1.
3️⃣ Shark
The standard shark is shown in the figure below, but the position of the volume candlestick needs attention:
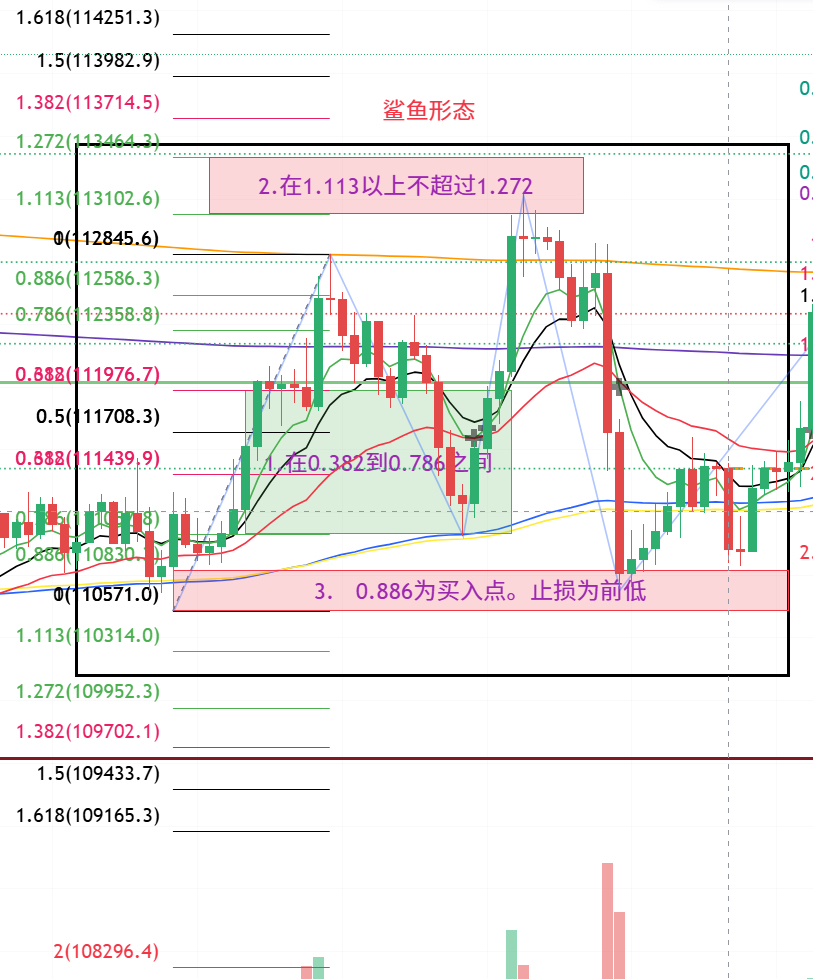
The risk-reward ratio is as shown in the figure, 3:1.
2026/3/16 Wishing everyone prosperity and successful trades every day 🤑
I usually update my views on BTC at the 15-minute level, and this technical series will continue to be updated after reaching the follower count target. I can start streaming, and I will come to chat at the end of the month!
Then there is a discussion group; you can contact me through X (formerly Twitter) via the homepage introduction. Welcome to communicate together.