
Analyzing AIUSDT on the weekly timeframe. The asset continues to move in a stable descending channel, where the price consistently forms lower highs and lows. The market is currently closer to the lower boundary of the channel, which may indicate a potential stabilization zone or a local rebound.
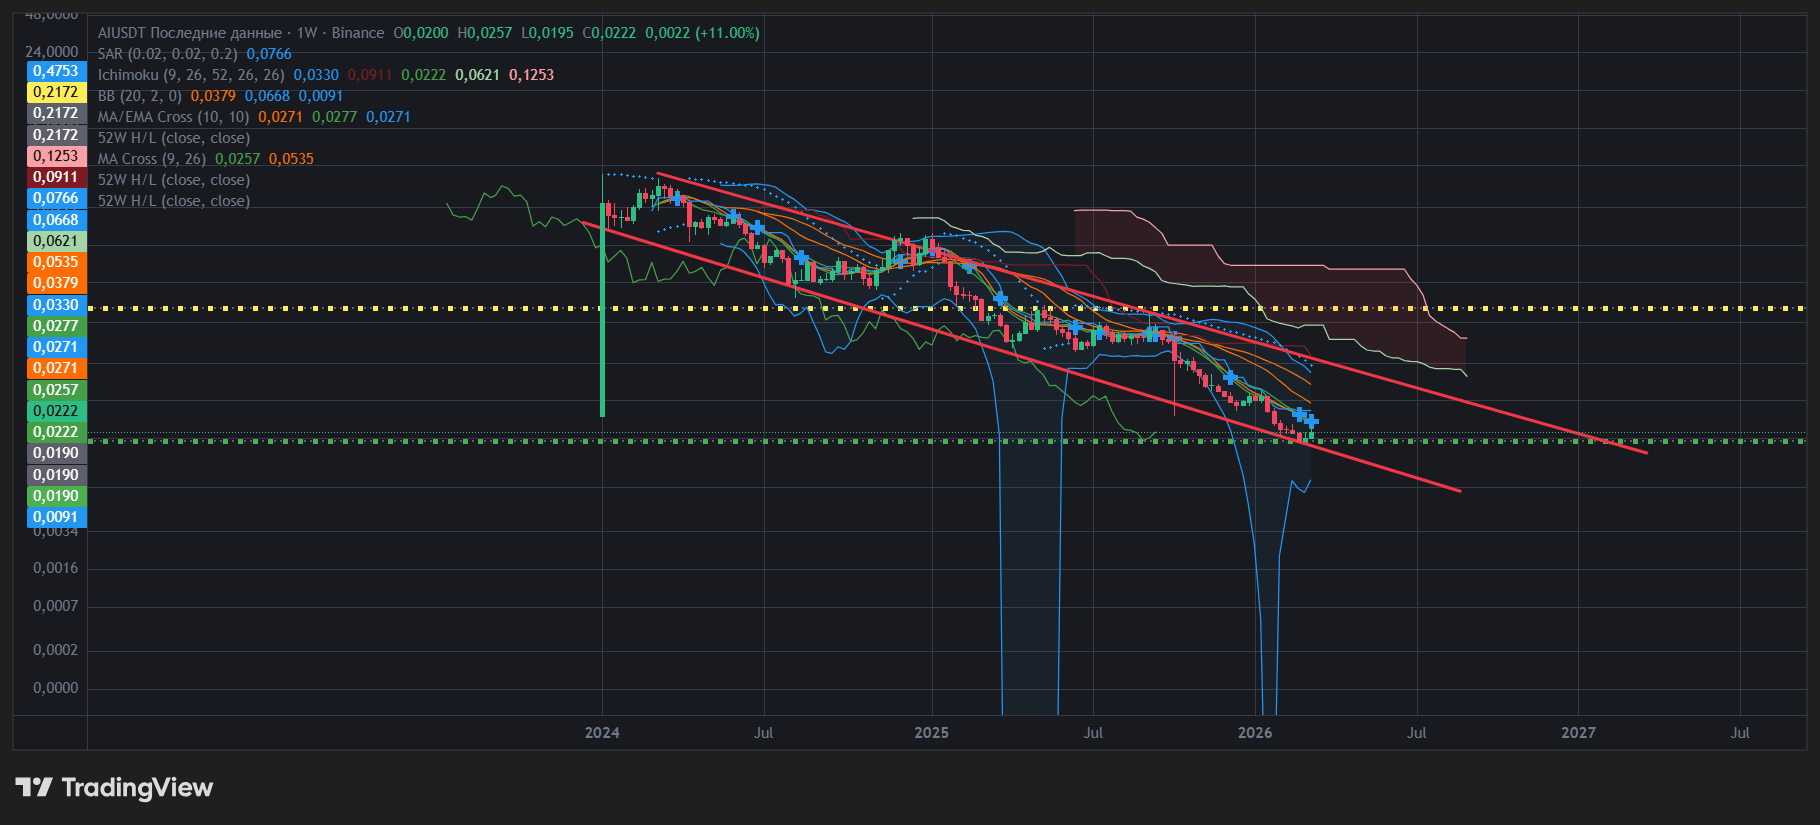
According to EMA Cross (9/26), the fast and slow averages are directed downward — this confirms the continuation of the bearish trend. MA/EMA Cross (10/10) is also positioned above the price and acts as dynamic resistance.
Bollinger Bands (20) indicate that the price is at the lower boundary of the bands, which often signals oversold conditions and a potential short-term recovery.
According to Ichimoku (9, 26, 52, 26), the price is below the cloud, and the cloud itself acts as a strong resistance zone. The indicator lines are also directed downward, confirming the dominance of sellers.
Parabolic SAR (0.02 / 0.2) is positioned above the candles, indicating a continuing downward momentum.
I would like to draw attention to the 52-week High / Low:
52-week high — 0.0766
52-week low — 0.0217
The price is currently near the bottom of the annual range, which historically often becomes an accumulation zone.
Key levels:
support — 0.0220 / 0.0217
resistance — 0.0270 / 0.0330 / 0.0530
Overall, the structure remains bearish, but the proximity to 52-week lows increases the likelihood of forming a base and a subsequent attempt to recover to the nearest resistance levels.
