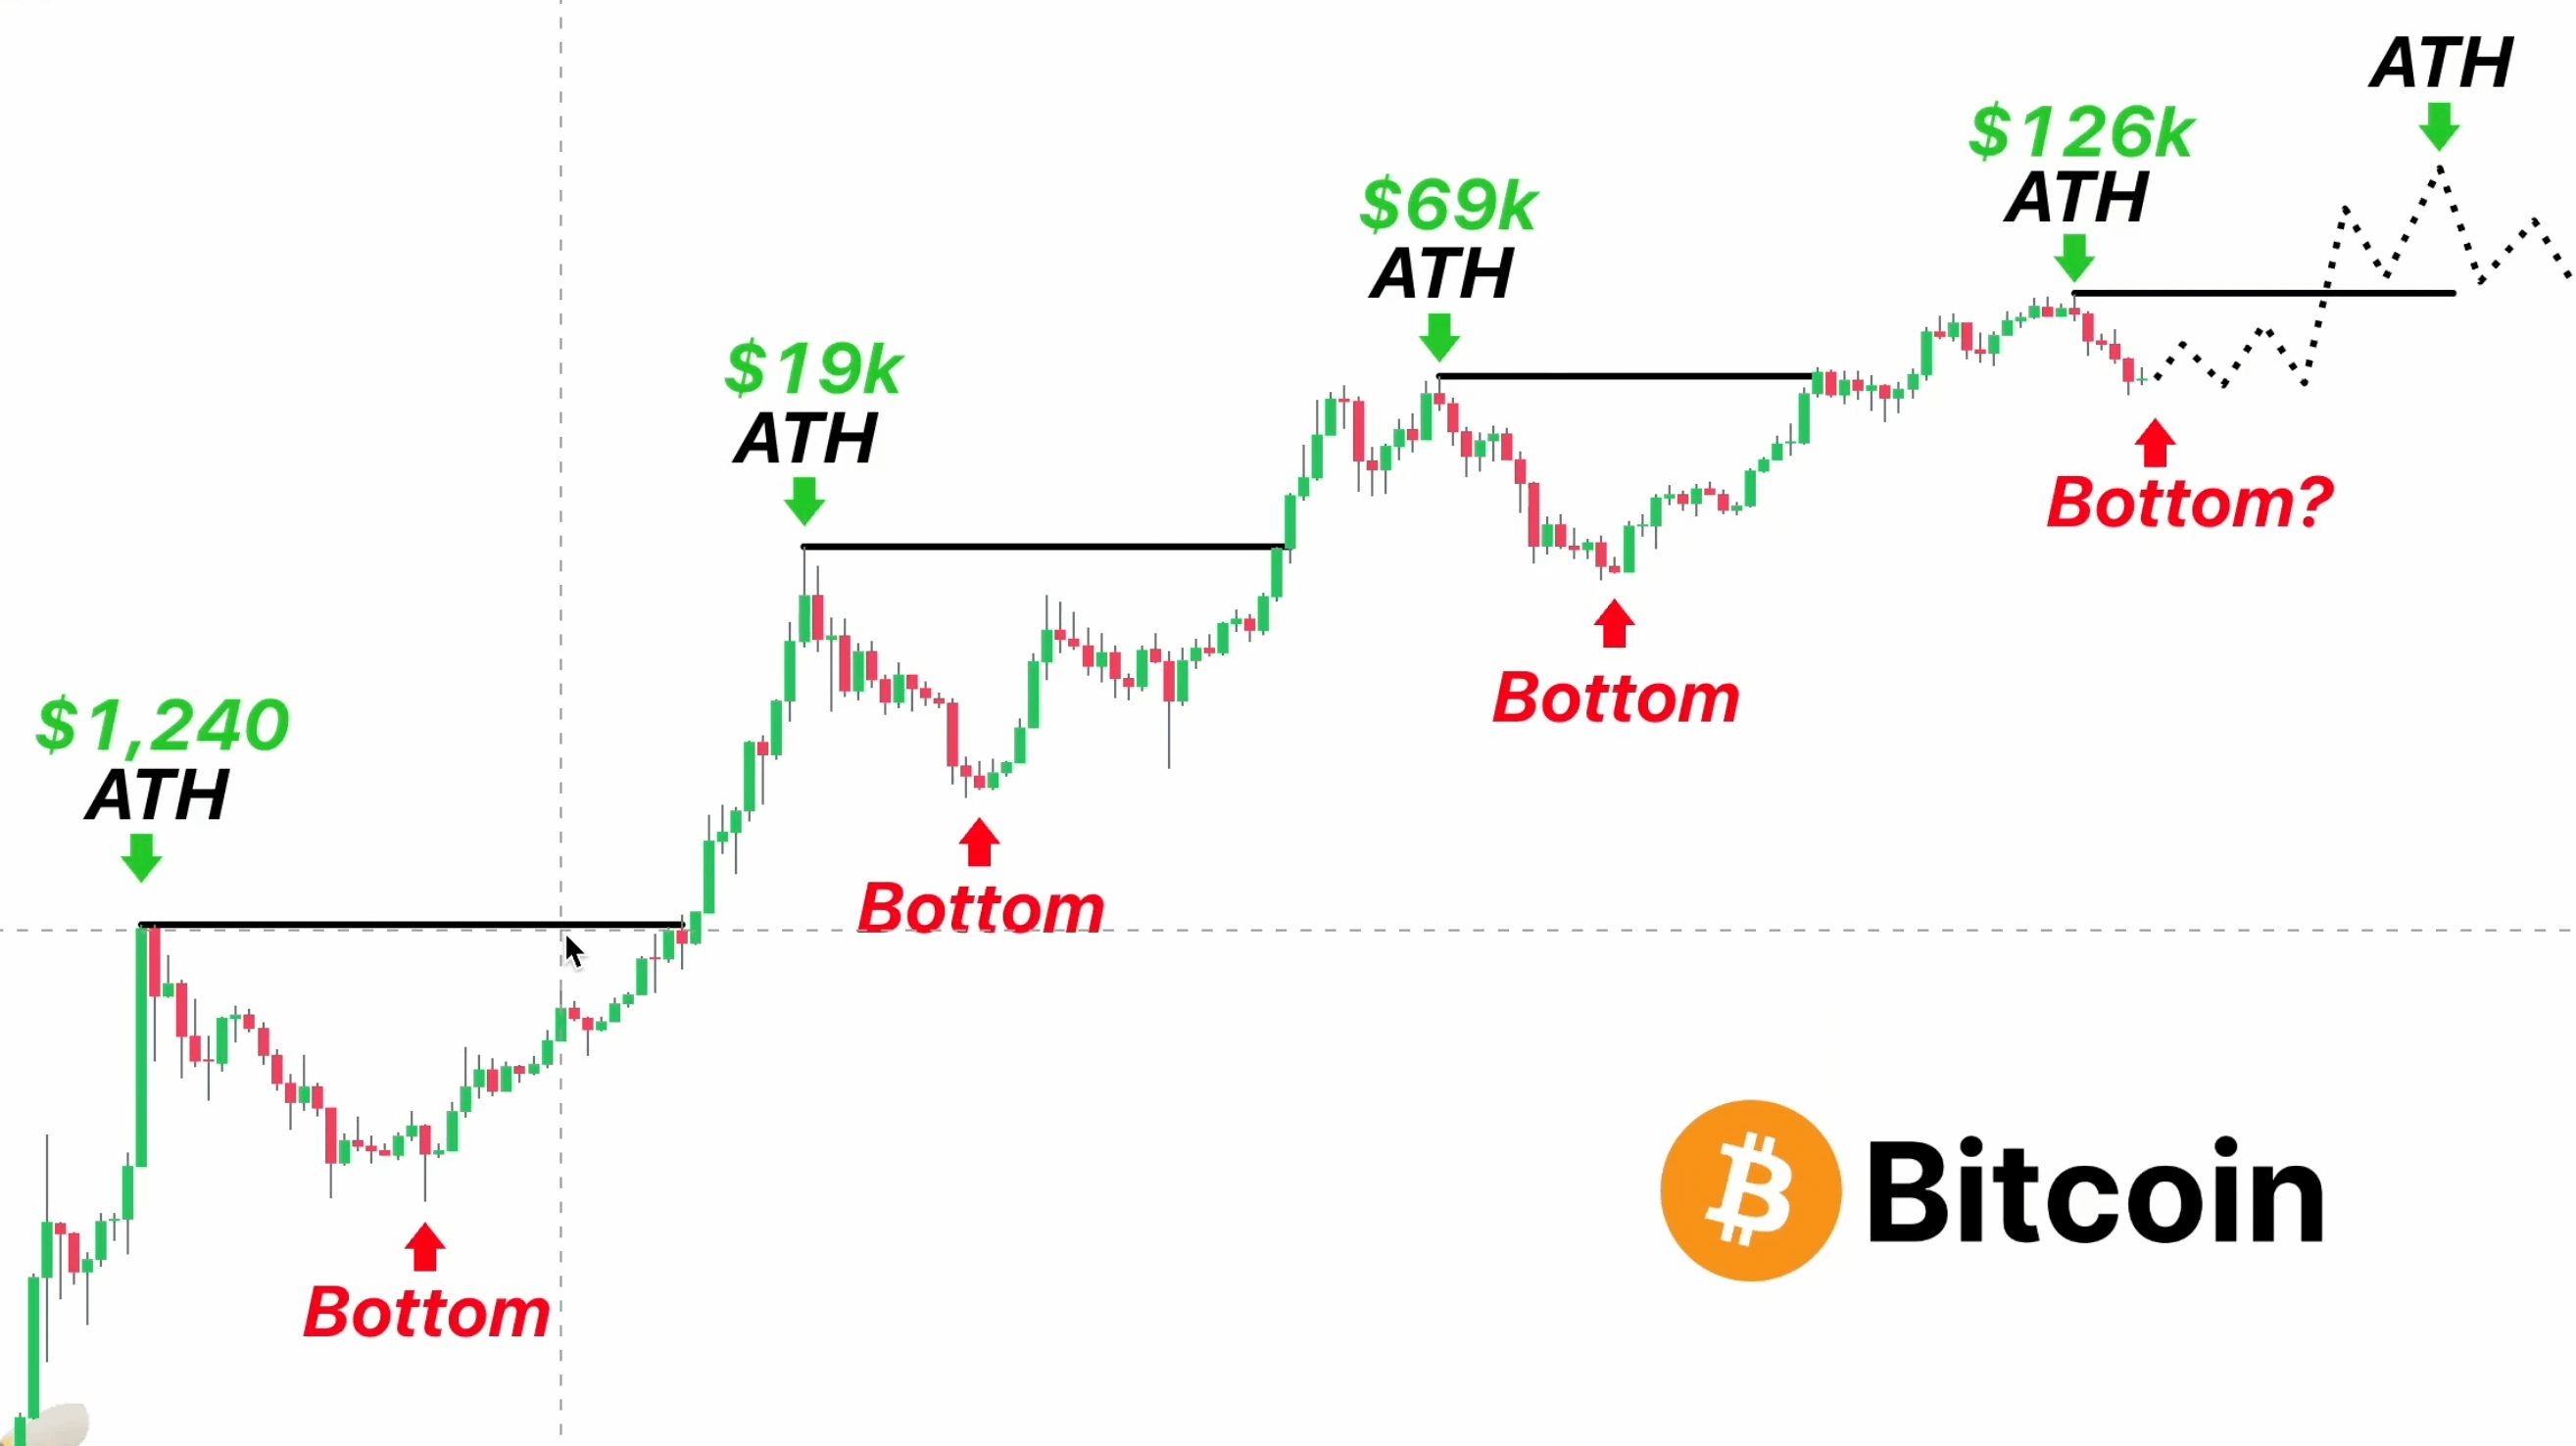
 This chart is signaling something that many people may not want to look directly at: the current bounce of Bitcoin $BTC may very well just be a bullish trap. It is noteworthy that this pattern is not new.
It is repeating the structure that appeared in 2022, a period when the market also harbored hopes for a recovery, before being swept into a deeper decline.
Currently, the general sentiment is still waiting for a strong bounce to confirm the bullish trend returning. However, that very expectation could become a factor that traps many people.
When too many positions are opened based on the belief that a bottom has formed, the market often chooses to go in the opposite direction to cleanse all early excitement.
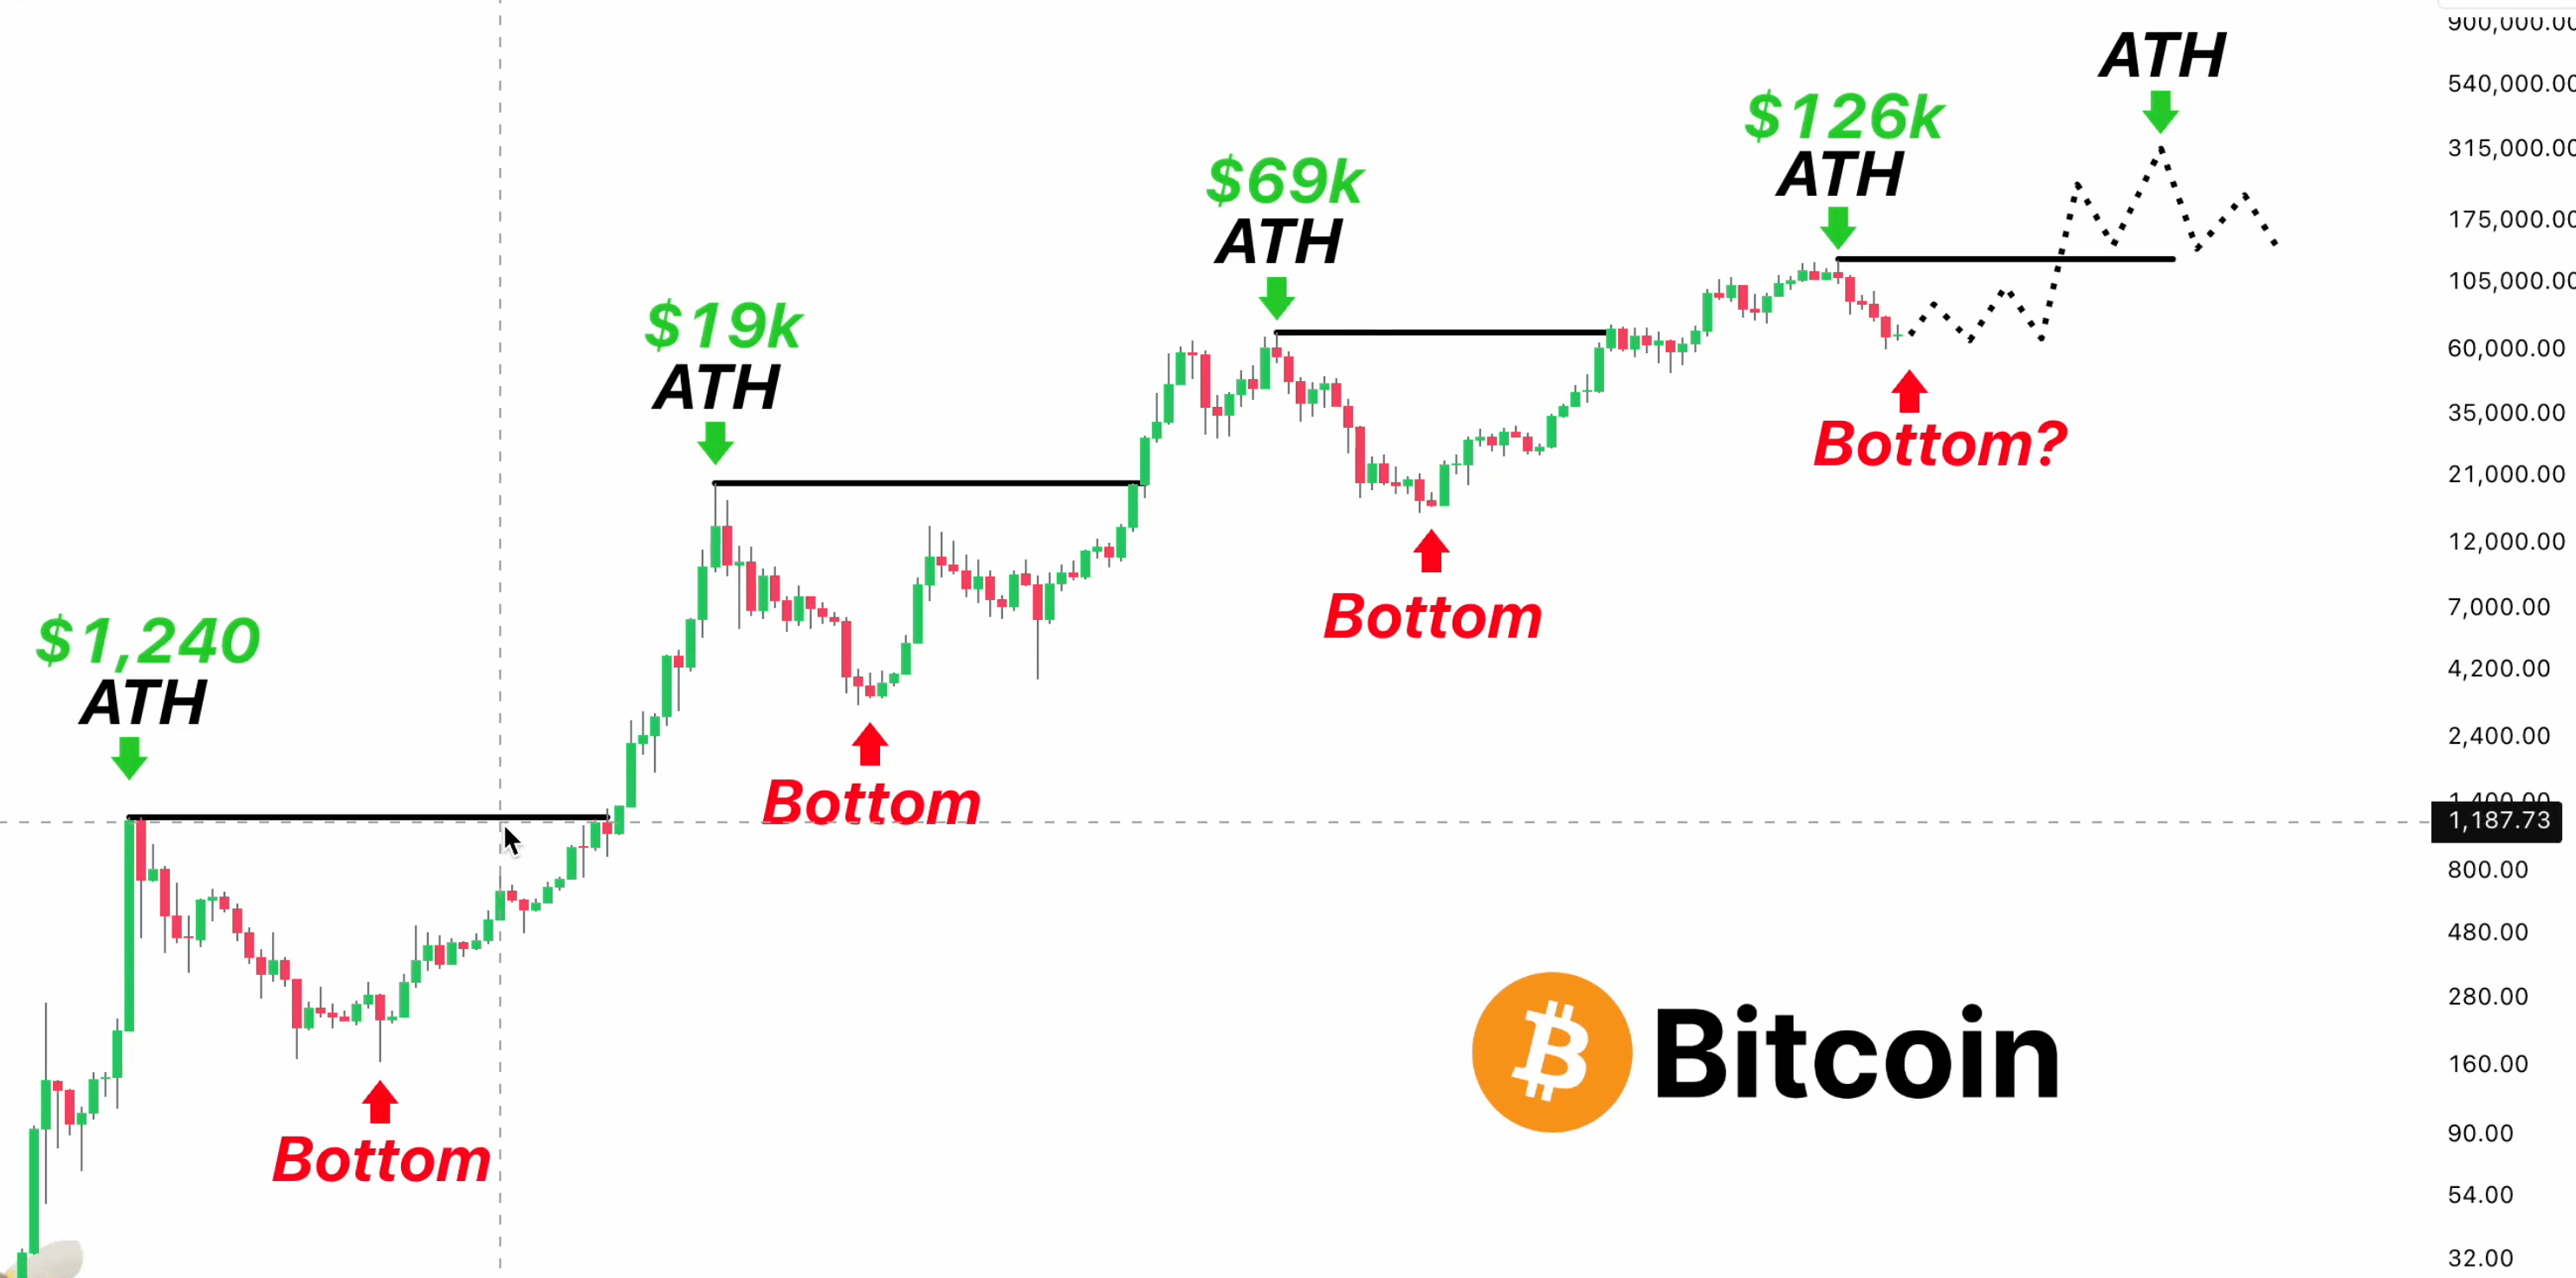
If viewed through this lens, the scenario ahead is not very positive. The current price structure suggests that Bitcoin may be in the final stages of a technical rebound before entering a stronger slowdown phase.
In the event that history continues to repeat itself, the $40,000 range could very well become the next target within the next 12 days.
Although this is not yet a certainty, it is clear that the risks are much greater than what the majority of the market wants to believe.
