Type 1
1. Work hard for two months to increase the principal to around 10,000.
2. Buy coins when Bitcoin's weekly line is above MA20, buy two to three, must be new coins, hot coins in a bear market, like APT* before it rose, it came out of the bear market, as long as Bitcoin rises a little, it takes off, like OP. Just remember, it needs to have heat, and there should be a story to tell.
3. Stop loss when Bitcoin falls below MA20, continue to make money during the buying or waiting period, give yourself two to three chances to fail. If you have a deposit of 20,000, invest 10,000, you can fail three times.
4. If you buy coins like apt, sell for about 4-5 times. Continuously execute the strategy, remember that with small capital, you must buy new coins and avoid ETH+ and BTC+. Their price increases cannot support your dreams.
5. If the bear market starts to transition to a bull market, if you can achieve three times 5 times, it’s about 125 times. This period can be as short as a year and as long as three years. You have three chances to fail; if you fail all three times, it shows you do not have the capability, so stay away from this circle, avoid investment, and do not fall into contracts.
In short, remember to enter the market when you should, to stop loss when you should, and to have patience.
The second type
1. Add coins that have risen on the list within 11 days to your watchlist, but be careful to exclude those that have dropped for more than three days to avoid capital outflows.
2. Open the K-line chart and only look at coins with monthly MACD golden cross+.
3. Open the daily level K-line chart, only look at one 60 moving average+. As long as the coin price pulls back to the vicinity of the 60 moving average and a volume K-line appears, then enter the market heavily.
4. After entering the market, use the 60 moving average as the standard. If it’s above the line, hold; if it’s below, exit and sell. It is divided into three details. When the wave’s rise exceeds 30, sell one-third.
② When the wave's rise exceeds 50, sell one-third
③ The most important thing, which is the core that determines whether you can profit, is that if you buy in on the day and unexpected situations arise the next day, resulting in the coin price directly dropping below the 60-day moving average, then you must exit completely and not hold any lucky thoughts.
Although the probability of breaking the 60-day line is very low using this method of selecting coins based on monthly and daily lines, we still need to have risk awareness. In the crypto circle, protecting your capital is the most important thing. Even if you have already sold, you can wait until it meets the buying conditions again to buy back.
Ultimately, the difficulty in earning Q is not the method, but execution.
A trading system is a weapon that enables you to achieve stable profits. It can help you mark key positions, discover entry signals, and find trading opportunities that allow you to make money.
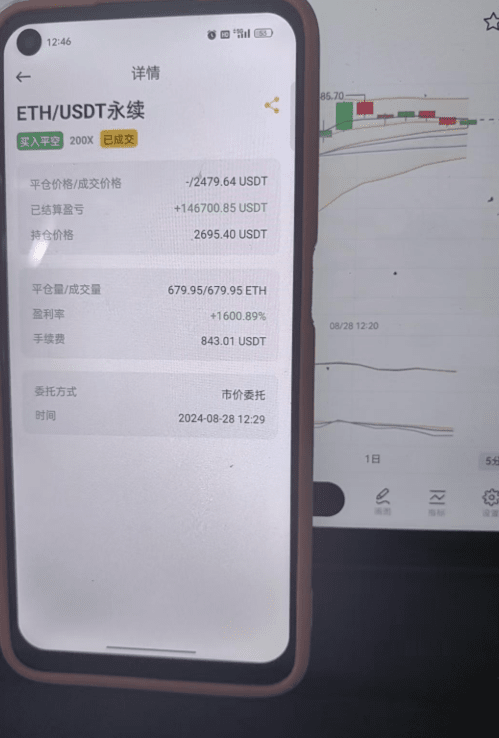
What method was used to earn over 30 million in ten years!
The core is summed up in one sentence: Amplify profits through contract trading! But don't rush in; first, convert this 2,000 into 300U (approximately 300 dollars), and let’s proceed in two steps:
Step 1: Small capital snowball (300U 1100U)
Take out 100U each time to play, choosing the most popular coins recently. Remember two things:
① Run away once you double your money (for example, if you turn 100 into 200, withdraw immediately) ② If you lose down to 50U
Just cut losses. If you're lucky and win three times in a row, you'll roll to 800U.
(100-200~400~800). But take profits when they come! Play a maximum of three rounds; once you earn around 1100U, stop. This stage relies heavily on luck, so don’t be greedy!
Step 2: Use more money to combine punches (starting from 1100U)
At this time, divide the money into three parts to play different tricks:
1. Quick in and out type (100U)
Specialize in 15-minute rises and falls, stable coins like Bitcoin/Ethereum. For example, if you see Bitcoin suddenly surge in the afternoon, immediately follow the trend, earn 3%-5%, and then exit quickly, like a street vendor, small profits through many sales.
2. Buddhist-style regular investment (15U per week)
Every week, consistently invest 15U in Bitcoin contracts (for example, if it is currently 50,000 dollars, you believe it can rise to 100,000 in the long term). Treat it as a piggy bank; don’t panic if it drops, wait half a year to a year, suitable for those who don’t have time to watch the market.
3. The main event trend order (put all the rest in)
Seize the big trend and strike hard! For example, if you find that the Federal Reserve is about to cut interest rates, Bitcoin may soar. Open a long position directly. But you must think ahead: how much to earn before running away (for example, doubling), how much to accept in losses (maximum 20%). This tactic requires understanding news and technical analysis; beginners should not act recklessly!
Important reminder:
① Bet a maximum of 1/10 of your principal each time, don’t go all in! ② Set a stop loss for each order!
③ Play a maximum of 3 trades per day, if you feel itchy, go play games. ④ Withdraw profits when you reach your target; don’t think about 'earning another wave'! Remember: those who rely on this method to turn around are tough; they are ruthless to others and even more so to themselves!
Simple and practical trading tips:
1. Divide into batches: Suppose you have 10,000, divide it into five parts, and use one part, which is 2,000, for each trade.
2. Buy a little to see: Use this 2,000 to buy a coin and try it out.
3. Buy again when it drops: If the price of the coin drops by 10%, then buy again with one part of the money.
4. Sell when it rises: If the coin price rises by 10%, sell a portion quickly to make some money.
5. Repeat the above steps: just buy and sell until your money runs out or the coins are sold out.
The benefits of small tips: The advantage of this strategy is that even if the coin price drops, you don’t have to panic because you can continue to buy. In fact, if you have spent all five parts of your money, the coin price has already dropped by almost half. But unless the market is particularly bad, the coin price generally won't drop so quickly. Moreover, every time you sell, you can earn 10% of the money. For example, if you have 100,000 and use 20,000 each time, you can earn 2,000 each time.
No more talk!
I share my trading strategies and insights with friends. There is a saying, standing on the shoulders of giants can save you ten years of effort. Friends who happen to see this and want to improve their trading skills should read more carefully and consider saving it!
To measure whether a strategy is 'good' or 'bad', quantitative backtesting is an effective and commonly used method.
However, in traditional quantitative backtesting, users need to obtain historical trading data themselves, write strategy logic code, and visualize various evaluation indicators. Obviously, for retail investors, if they do not have a certain technical background, as well as strong interest, perseverance, and confidence, it is very difficult to persist.
So, if achieving this through technical indicators is possible, it will greatly lower the threshold for retail investors to conduct quantitative backtesting, allowing more people to enjoy the benefits of using more scientific and objective methods.
So, can quantitative backtesting be achieved through technical indicators?
In previous articles, we demonstrated a strategy based on VWAP + EMA which can go long or short, with stop-loss and take-profit for both sides. Considering the complexity, we later demonstrated the Dual Thrust, a reversal system that does not use stop-loss.
However, it is clear that the expected results have not been achieved. It may still be a bit complex, so we will demonstrate again based on the double moving average strategy.
In quantitative backtesting, a market index is generally chosen as the benchmark. For example, the backtesting of A-shares is compared with CSI 300, and the backtesting of US stocks is compared with S&P 500.
There is an implicit condition here, which is that the strategy is not targeted at a specific stock. After all, the index itself can be seen as a strategy, and constituent stocks can be seen as its holding list. Therefore, if it is just a simulation, I think it is fair to directly use the target itself as the benchmark, treating the target’s trend as holding unchanged to measure whether the adopted strategy has excess returns.
Benchmark return
Since the target’s trend itself is used as the benchmark, we only need to determine a backtesting time range and then compare the daily closing prices with the closing price at the backtesting starting point.
For example, using the double moving average code above, we start from Christmas of 2024 and backtest the effect of the CSI 300 index at the hourly level.
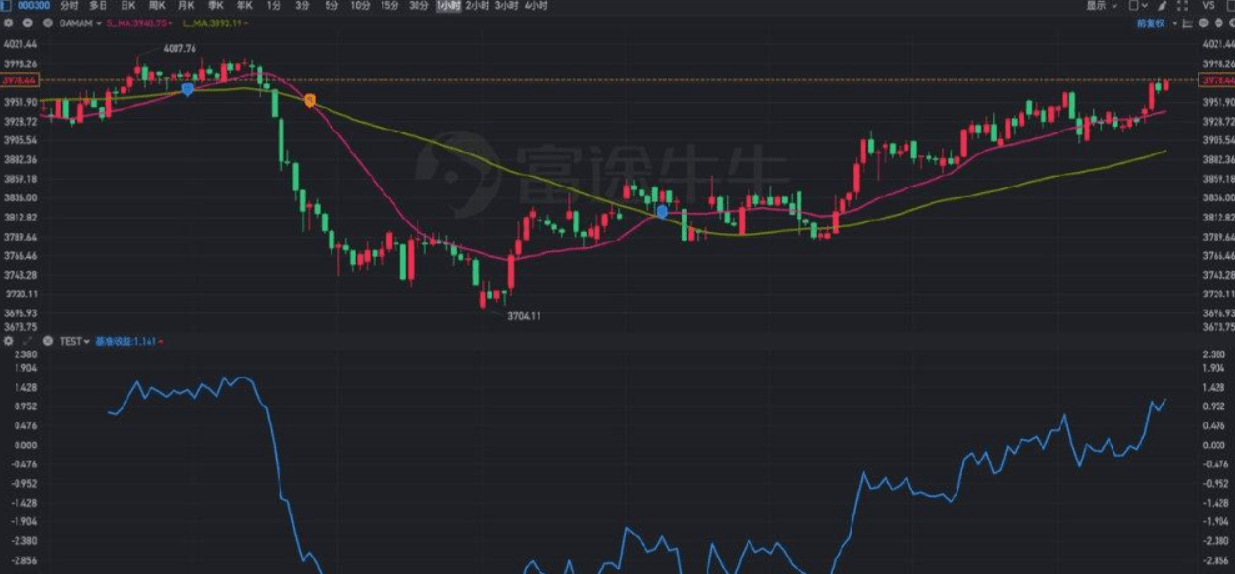
Benchmark return
It can be seen that the benchmark return indeed changes with the fluctuations of the K-line.
Strategy return
Calculating strategy returns is a bit more complicated than the benchmark.
First, handling of buy signals.
Because backtesting has a starting point, if there is a buy signal before the backtesting starts, you need to set a rule: is it signal optimization or time priority? If it is signal priority, as long as there is a buy signal before the backtesting starting point, buy at the starting point; if it is time priority, wait for the first buy signal after the starting point to buy.
I think the signal should be prioritized, so at the starting point, we will judge whether the last signal was a buy or a sell. If it was a sell, we will not process it; otherwise, we will buy, which starts calculating the strategy return.
Then comes the handling of sell signals.
Imagine if we cleared out fully after earning 30%, as long as we do not enter the market again, our return rate should be a straight line, always at 130%. Only when a buy signal appears again will it continue to change based on the 130% return rate.
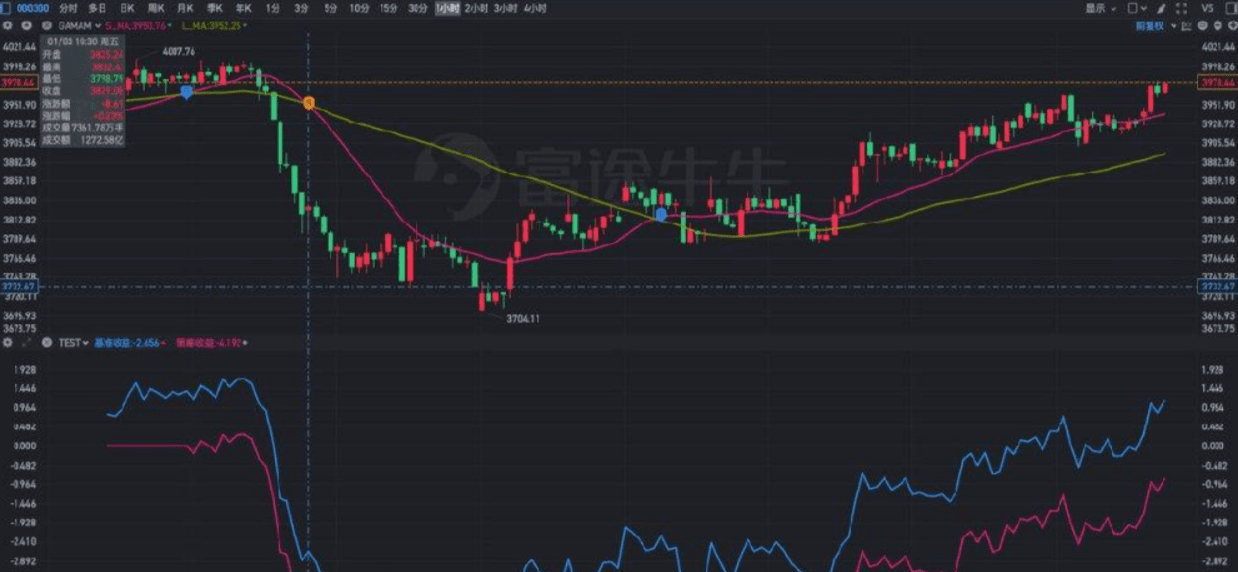
Strategy return
At the starting point on the far left, since there is no buy signal yet, the strategy's return rate is zero, and it only begins to change once a buy signal appears.
Then, after the sell signal, the strategy return becomes a straight line until a buy signal appears again.
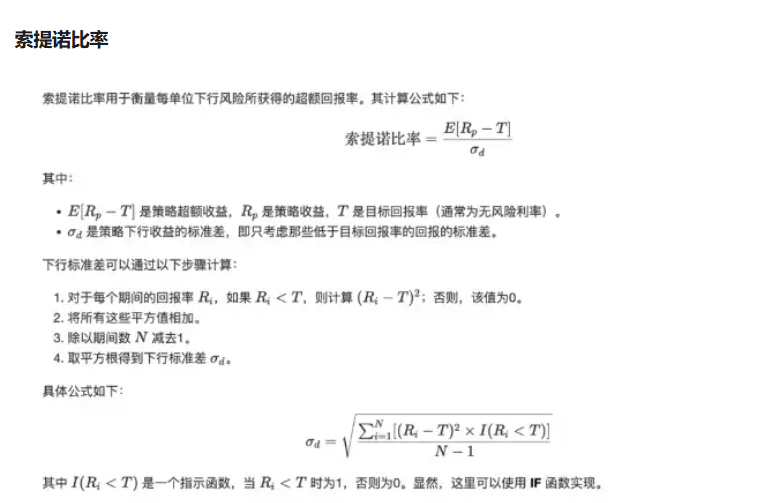
Drawdown curve
Having determined the strategy return, calculating the drawdown will be relatively simple. At each time point, the corresponding strategy return minus the maximum return rate from the starting point to this time point will give the drawdown, and the minimum drawdown over the entire backtesting period is the maximum drawdown.
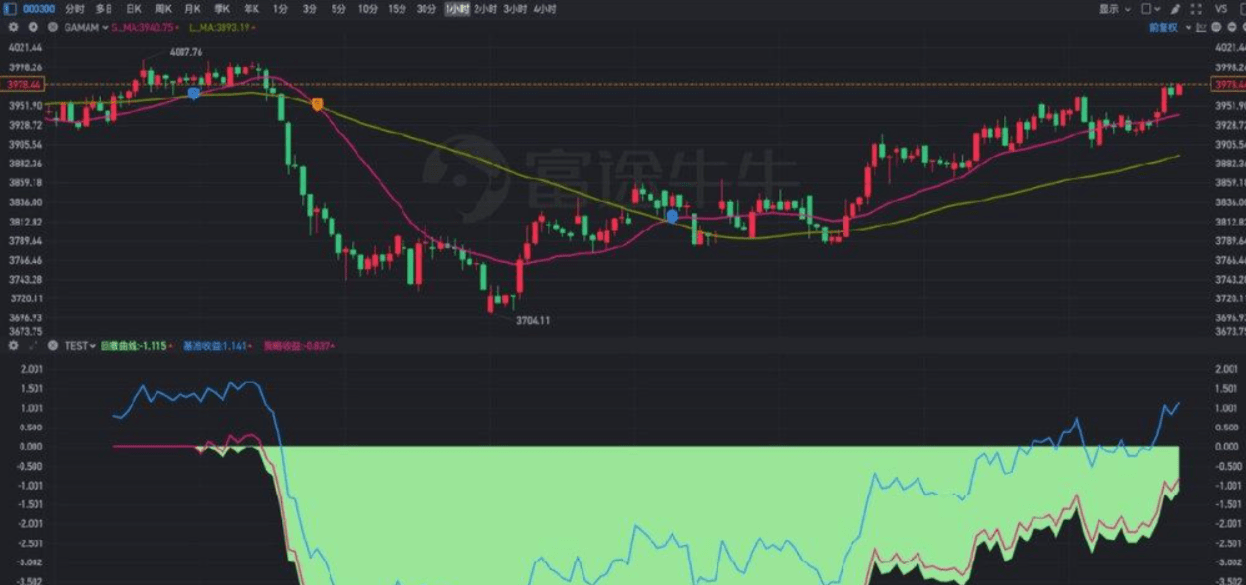
Drawdown curve Sharpe ratio
Since it is a simulation, we certainly won't introduce new variables. Moreover, even in real quantitative backtesting, obtaining the historical risk-free interest rate over the years is a hassle. So, we set it to zero here.
Additionally, to save trouble, considering that 256 can be directly opened, we simply multiply by 16 when calculating the annualized Sharpe ratio.
After introducing two commonly used evaluation indicators in quantitative backtesting, we will now look at how to use this tool.
Statistical analysis
Quantitative backtesting's most important function is to verify the effectiveness and robustness of a strategy. A strategy must first be validated through backtesting to determine whether it can obtain returns, and to what extent.
This is a crucial premise; otherwise, if historical data from backtesting has not yielded returns, how can we believe it can achieve returns in the future?
So, how should we evaluate the potential profitability of a strategy?
The expectation value combining win rate and profit-loss ratio is a comprehensive indicator that can effectively evaluate the expected profitability of quantitative trading strategies.
The so-called win rate is the ratio of profitable trades to total trades; the profit-loss ratio is the average of winning trades divided by the average of losing trades. To calculate the expectation value, multiply the average profit by the win rate and subtract the average loss multiplied by the loss rate to get the expected profit level of the strategy.
Win rate, profit-loss ratio, expectation value
As shown in the figure, there were two trades: the first loss and the second profit, resulting in a win rate of 50%, but the first loss was relatively large, so the expectation value is a negative number.
With such intuitive quantitative data, we can optimize the strategy in terms of parameters and logic.
Parameter optimization
At the beginning of quantitative backtesting, it is hard to resist the temptation to optimize parameters. Because this method is the simplest and has immediate effects. Of course, if you just make simple adjustments to the parameters, you inevitably have to pay attention to the issue of overfitting.
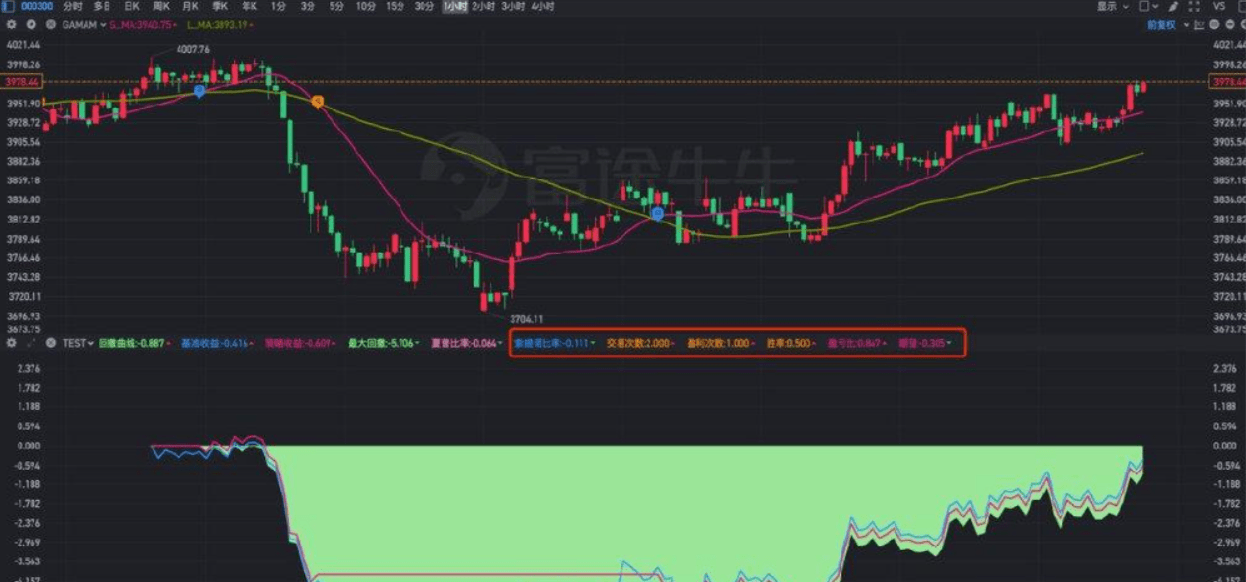
Fortunately, for the double moving average strategy used in the example, the two parameters of 20 and 60 at the hourly level are indeed a bit too large and should be set differently according to different time levels.
The smaller the time level, the smaller the range of fluctuations. If larger parameters are still used, it won’t solve the inherent lagging problem of the double moving average. Therefore, the adjustment of parameters here has a certain logical basis, and we will adjust them downwards and then see the effect.
Parameter optimization
Although the win rate decreased compared to before, the final strategy return and expectation value became positive. Of course, this is only an example of parameter optimization; usually, you still have to be wary of overfitting.
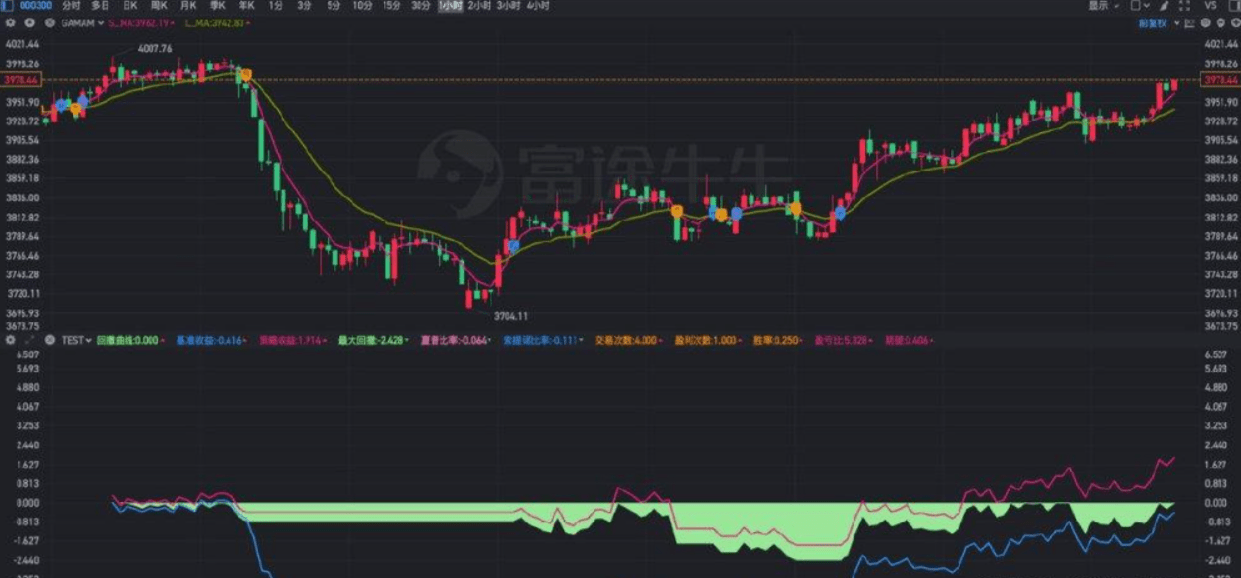
Logic optimization
The most critical aspect is still the optimization of logic.
In response to the lagging issue of moving averages, from MA to EMA, still DMA, KMA, strictly speaking, the moving average algorithm has changed, and it is indeed quite different from simply changing parameters, so we can also consider it an optimization of logic.
As for considering the inherent issues of the moving average system and how to systematically think about the optimization of logic, we will consider adding indicators such as KDJ, RSI, CCI for filtering methods in the next article.
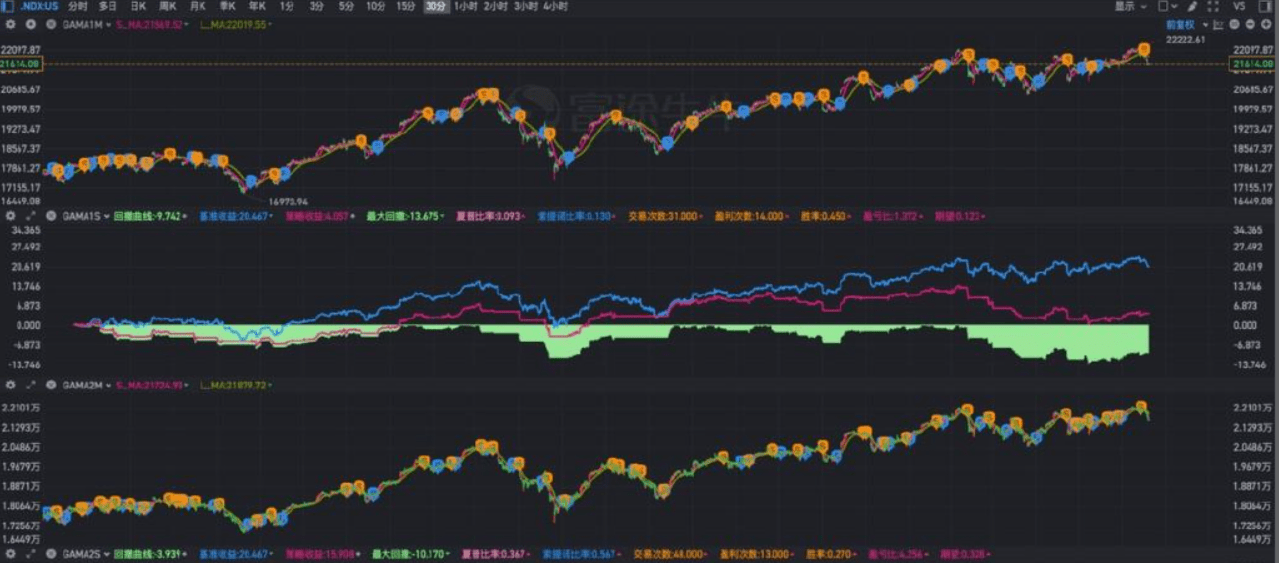
Modify the starting point, backtest for a year, then modify the moving average algorithm, load them all into the chart, and directly compare the two strategies.
Strategy comparison
Obviously, with such a tool, we can freely switch to any time level of stocks, indices, or futures for backtesting.
Knowledge
Although we have realized the basic quantitative backtesting function based on technical indicators, the expression capability of indicator formulas is limited and cannot encapsulate into a backtesting framework like true programming languages such as Python.
Moreover, currently, many indicators also have some subjective biases in their usage. Even if based on some experience, trying to combine various indicators into a trading strategy, there are still certain difficulties in the implementation of specific functions.
Therefore, this will be an iterative process, the functionality of backtesting will continue to improve, and the supported strategies will continue to increase. So, we will set up an X.Y.Z version for organization.
Here, X represents the milestone version, which will involve major updates in logic, concepts, and forms; Y represents the regular version, which will involve updates on expected features; Z represents the strategy version, which means new support for certain trading strategies.
One step ahead, every step ahead. I hope this backtesting tool based on quantitative concepts can provide some assistance to everyone.
A single tree cannot form a boat, and a lone sail cannot sail far! In this circle, if you do not have a good community and do not have first-hand news from the crypto circle, then I suggest you follow me, and I will help you make a profit, welcome to join!!!#美SEC和CFTC加密监管合作 #狗狗币ETF进展 $ETH


