Today's sharing is 'Ultra Short-term Trading of Coins'
Skills + and short-term trading no longer fear losses in the circle, although not everyone can achieve 2 small goals with 10,000, I am already very content, and stable and at ease, dreaming that by the end of this year my account can break 100 million, and next year there will be more capital to earn more money.
If you are determined to make trading your primary profession, this article will be your stepping stone, very short and profound! After 10 years of trading coins, the core trading secret for my stable compound interest.
In the coin circle, everyone has heard the story of 'turning 10,000 into 1 million', but the reality is that most people not only haven't made money but have instead been completely harvested by the market.
We have no inside information, no financial advantages, and no trading experience that can withstand several rounds of bull and bear markets. All we can rely on is to understand the market, understand ourselves, establish rules, and control our emotions.
The cryptocurrency world is not a shortcut to getting rich, but a Shura field where only a few people survive.
First understand the market: this is a world where uncertainty is king
The essence of the market is not a technical game, but a highly complex probability game.
You have to accept that no matter how good your strategy is, it cannot consistently generate profits in all environments. Any trading system that claims a "100% win rate" is a scam.
What we can do is not to beat the market, but to adapt to the market and use discipline to fight uncertainty.
Profits and losses come from the same source: How you make money determines how deeply you lose money. Heavy-weight all-in: You may double your money, or it may go back to zero. High leverage to catch a rebound: You can get a bite of meat, but if the direction is wrong once, you will be directly liquidated. Flattening against the trend: Sometimes you can get out of the predicament, but in a unilateral trend, it is chronic suicide.
The traders who can really survive are those who repeatedly bet on the "probability advantage" in a systematic way - they earn more when they are right and lose less when they are wrong.
Most people die in the market not because of ignorance, but because of self-righteousness: obsession with predictions: trying to catch all the tops and bottoms; technical obsession: piling up indicators but ignoring positions and risk control; superstitious belief in luck: taking credit for profits and blaming the market for losses; overconfidence: thinking they are the best after a few consecutive profits;
Remember: Discipline > Technique, Execution > Inspiration, Stability > Stimulation.
The trades that really make money are often boring.
The underlying logic behind ordinary people making money
You don't need to be a genius, you just need to establish a trading system that can be replicated and maintained.
1) Capital management: Use only a small portion of your total capital each time you open a position. Try to increase your position after confirming the trend. Don't go all-in right away. The total position should not exceed 30%, leaving room for maneuver.
2) Short-term trading: suitable for those with strong market sense and quick reaction; Swing trading: suitable for those who can withstand fluctuations and follow the trend; Long-term trading: those who understand macro and fundamentals have a better chance of success
3) The trading system should be simple, executable, and replicable. Trend strategy: follow the trend and don't increase your position against it. Swing strategy: buy low and sell high, and stop loss quickly. Arbitrage strategy: cross-platform price difference, small fluctuation arbitrage, high winning rate but slow.
4) Stop-loss and take-profit must be executed mechanically. The stop-loss line should be set before entering the market. When the time comes to cut positions and take profits, you can exit in batches. Don't be greedy or timid. It is enough to take advantage of the mid-term market.
5) Manage your emotions. Reduce the frequency of watching the market, avoid impulsive trading. Accept losses, don’t make up for losses, and don’t get complacent when you win. Keep a trading log, constantly review and optimize the system. 4. The key to survival: mindset and compound interest
The hardest thing to defeat in the cryptocurrency world isn't the market, but your own greed and fear. Your goal isn't to "make ten times your money in a year," but to achieve a stable annualized return, maintain strict stop-loss orders, and avoid being wiped out by the market.
Don't underestimate the matter of "being alive". Compound interest is the only way for retail investors to compete with institutions: 30% annualized, 20 times in 10 years; 50% annualized, 57 times in 10 years; double in one year, and a margin call in the second year, is 0.
And if you accidentally lose--
Final advice: Don’t be a “legend”, be a “survivor”
In the cryptocurrency world, legendary stories belong only to a very small number of people, and the vast majority of winners are ordinary people who can survive in the long market.
Make fewer mistakes, execute more, review frequently, and stay rational and patient.
The market is constantly changing, but the rules remain the same. Your only goal is to survive this turbulent time. If you're feeling lost, consider saving this article as a starting point for your trading journey. It's not about getting rich quick, but about staying relevant at the poker table.
mutual encouragement.
There are many ways to speculate, but not all of them can be learned. We all hope to get good returns using the simplest method. Friends in the circle are not unable to choose good coins, but think too complicatedly!
1. When entering the market, you cannot just look at the "K-line" trend of the cryptocurrency. Especially for short-term trading, you also need to look at the 30-minute K-line. At the same time, the market must stabilize and resonate at this moment before you can start. For example, sometimes you see a K-line with a long upper shadow and feel that there is no chance, but the next day it pulls out a big sun or even hits the daily limit. In fact, if you look at the 30-minute K-line, you will see the mystery.
2. If the trend and order are wrong, it is a mistake to look at it for a second. You must follow the trend and do not disrupt the rising order.
3. If the short-term investment is not in a hot spot or potential hot spot, it is better not to do it.
4. Give up all impulsive entry. Trade your plan, plan your trade.
5. Anyone's views or opinions are for reference only. You should think carefully and analyze them carefully on your own.
6. First lock in the direction and then select a coin. If the direction is right, you will get twice the result with half the effort; if the direction is wrong, all efforts will be in vain.
7. Invest in rising coins. It's a taboo to try to guess the bottom, always feeling like a rebound is imminent, followed by a final shakeout. Prices always move toward "minor resistance levels," so investing in rising coins means choosing the direction with the least resistance.
8. After a big win or loss, close your position and re-evaluate the market and yourself. It's never too late to act after understanding the reasons for the big win or loss. Over the years of cryptocurrency trading, I've found that closing your position after a big win or loss is over 90% correct. Ultimately, the key to making money isn't the method, but the execution.
The trading system is a weapon that can help you achieve stable profits
It can help you mark key positions, discover entry signals, and find trading opportunities that can make you money.
So, again, as long as you have a stable trading system, you can just take advantage of opportunities within the system. If you lose, you can just take revenge. Do what you should do well and leave the rest to the market. In the end, you will always be able to cover your losses with profits.
However, the biggest problem for 99% of people is that they do not have their own trading system, so they are afraid of losing money when trading, because once the money is lost, it cannot be earned back. Even if they earn it back by luck, they will eventually lose it all by their own ability.
1. MACD is the most commonly used indicator by experts
The MACD indicator* plays a unique role in technical analysis and is considered an essential component of any technical analysis program. Its importance stems from at least the following factors:
First, the MACD indicator is the most effective technical indicator that has been tested by historical trends and is also the most widely used indicator.
Second, the MACD indicator, derived from the EMA, is very effective in identifying market trends. Trend investors generally refer to this indicator in their daily trading.
Third, the top and bottom divergence + of the MACD indicator is the recognized and best-used "bottom-picking and top-selling" method. This method is an important tool for the concretization of trend theory and wave theory.
Fourth, many veteran traders have this experience: they first learn the MACD indicator when they are just starting out, then gradually abandon it, but after a long period of study and comparison, especially after actual combat testing, they finally return to the MACD indicator. This shows the specialness of this indicator.
Fifth, the MACD indicator is also widely used in quantitative trading.
Because of these advantages, the MACD indicator has become the most commonly used technical indicator by professional traders.
2. Concept and algorithm of MACD indicator
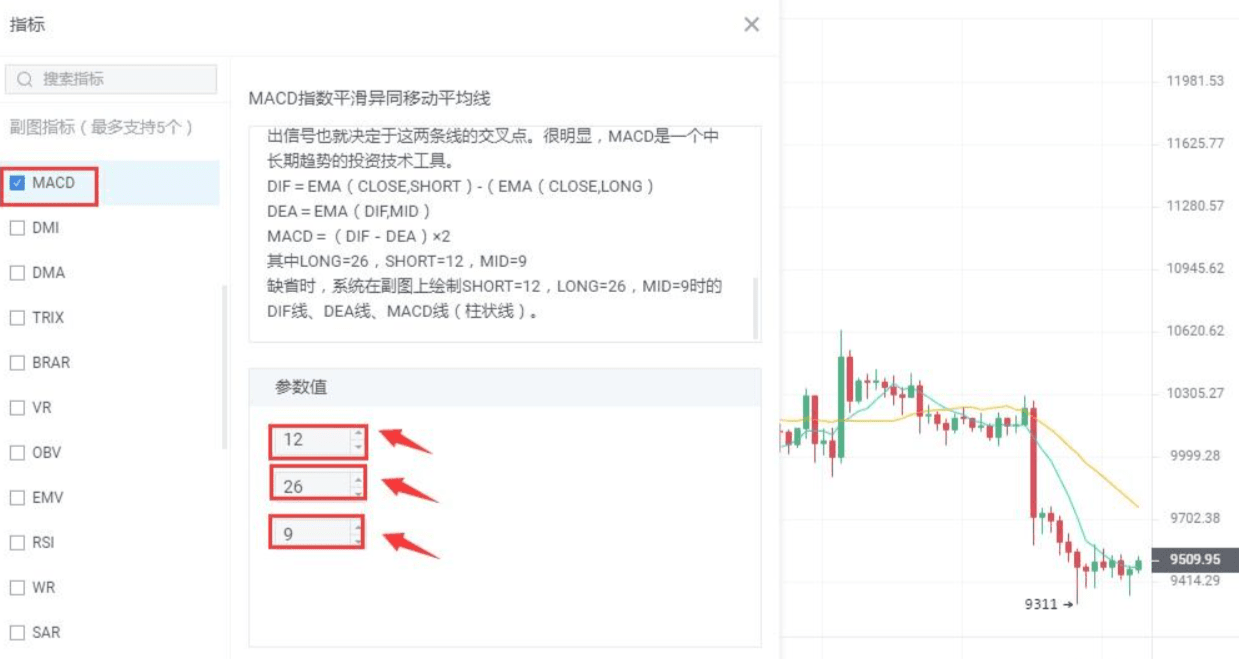
The MACD indicator, also known as the Moving Average Convergence Divergence, was created by Geral Apple as a technical analysis tool used to track price trends and determine the timing of candlestick chart buys and sells. This indicator is commonly used in market software and is known as the "King of Indicators." As shown in [Figure 1]
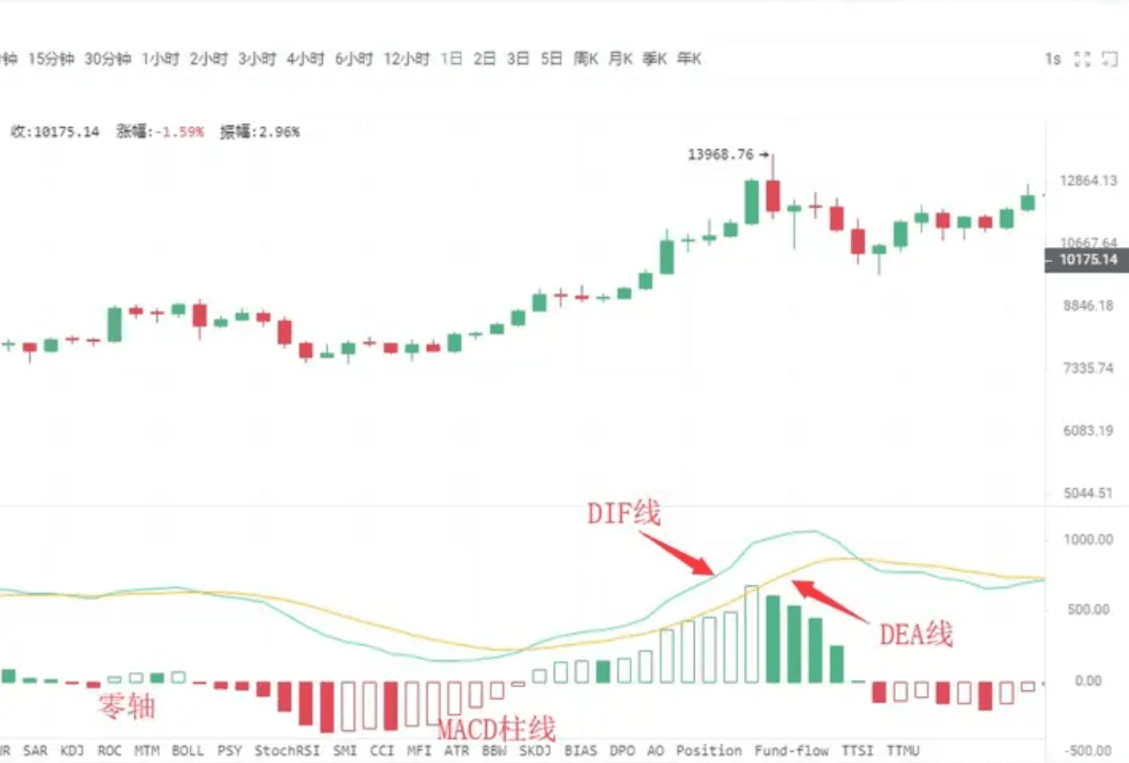
The MACD indicator in the cryptocurrency market consists of three lines and one axis: the DIF fast line, the DEA slow line, the MACD bar chart, and the zero axis. Investors use the intersections, divergences, breakthroughs, support, and resistance of these three lines and one axis to analyze prices. The fact that the MACD indicator is listed as the preferred indicator in many market software shows its wide application and also indirectly proves that it is one of the most effective and practical indicators that has been tested by history.
3. MACD Golden Cross and Dead Cross
The "Golden Cross" and "Death Cross" patterns are extremely important in technical indicator analysis. A Golden Cross, also known as a golden cross, occurs when a relatively short-term indicator line crosses upward and crosses over a relatively long-term indicator line (of the same type), often signaling a short-term buying opportunity. If a Golden Cross pattern appears after: 1. a short-term rapid decline; 2. a retracement during an uptrend; or 3. a consolidation during an uptrend, that is, at a specific low point, it is a more reliable buy signal.
A death cross, also known as a death cross, occurs when a shorter-term indicator line crosses downward and crosses over a longer-term indicator line (of the same type). This often signals a short-term sell opportunity. If a death cross occurs after ① a period of consolidation during a decline; ② a rebound during an uptrend; or ③ a short-term rapid rise during an uptrend, that is, at a specific high point, it is a more reliable sell signal.
After understanding the golden cross pattern and the death cross pattern, we can take a closer look at the golden cross pattern and the death cross pattern of the MACD indicator line. The golden cross and the death cross appear in different positions, which will reflect different market meanings.
Situation 1: Buying point of low golden cross
If the golden cross between the DIFF and DEA lines appears below and far from the zero axis, this is called a low-level golden cross. Investors can view this golden cross as merely a short-term price rebound. Whether the K-line can form a true reversal requires observation and confirmation in conjunction with other indicators.
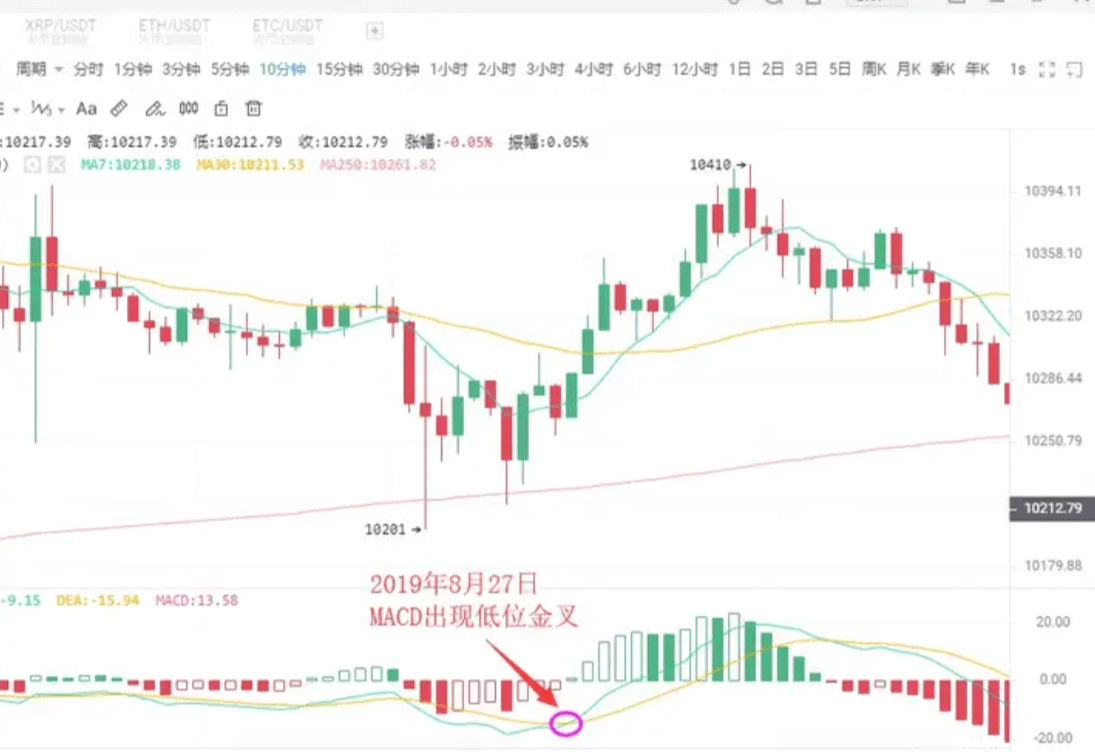
As shown in the figure above:
On August 27, 2019, the BTC 10-minute K-line chart showed a low-level golden cross as the price fell back, followed by a rebound of $200. Short-term investors can seize the opportunity to enter the market.
Case 2: Buying point of golden cross near zero axis
If an upward trend has been formed and the golden cross of the DIFF line and the DEA line occurs near the zero axis, then this is often an excellent time for investors to buy.
This is because, after the upward trend is formed, the golden cross near the zero axis indicates that the adjustment market has completely ended and a new round of upward market has started. At this time, if it is accompanied by the golden cross of the average volume line, it means that the price increase is supported by the trading volume, and the buy signal will be more reliable.
Once this buying point appears, investors should never miss it, otherwise they will miss the big rally.
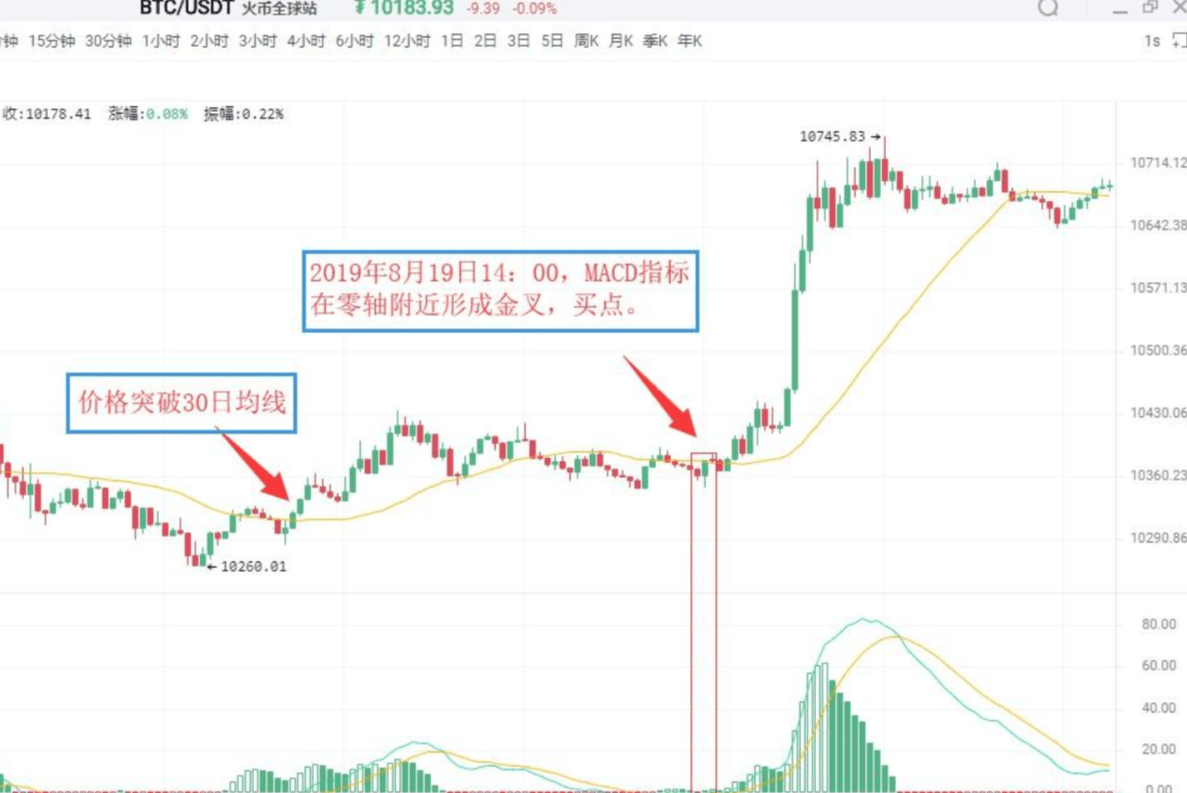
As shown in the figure above:
At 09:30 on August 19, 2019, the BTC 5-minute candlestick chart showed Bitcoin breaking through the 30-day moving average, indicating that an upward trend had initially formed. For a period of time thereafter, the price remained above the 30-day moving average.
At 2:00 PM on August 19, 2019, the MACD indicator formed a golden cross near the zero axis, indicating that the market is about to see a large upward trend. Investors can buy decisively.
Situation 3: Buying point of high golden cross
If the cross between the DIFF and DEA lines is above the zero axis and at a significant distance from it, it is called a high-level golden cross. A high-level golden cross typically occurs during a consolidation trend following an upward movement of the K-line, signaling the end of the consolidation and the imminent resumption of the previous upward trend. Therefore, the appearance of a high-level golden cross is a strong signal to increase your position.
In actual practice, when an upward trend is formed and the K-line rises slowly and lasts for a long period of time, once the MACD indicator forms a golden cross at a high level, it is often a sign that the K-line is about to accelerate its rise.
Because of this, high gold can also be used for swing trading. Investors can use the MACD indicator to continuously snipe the rising band in the upward trend.
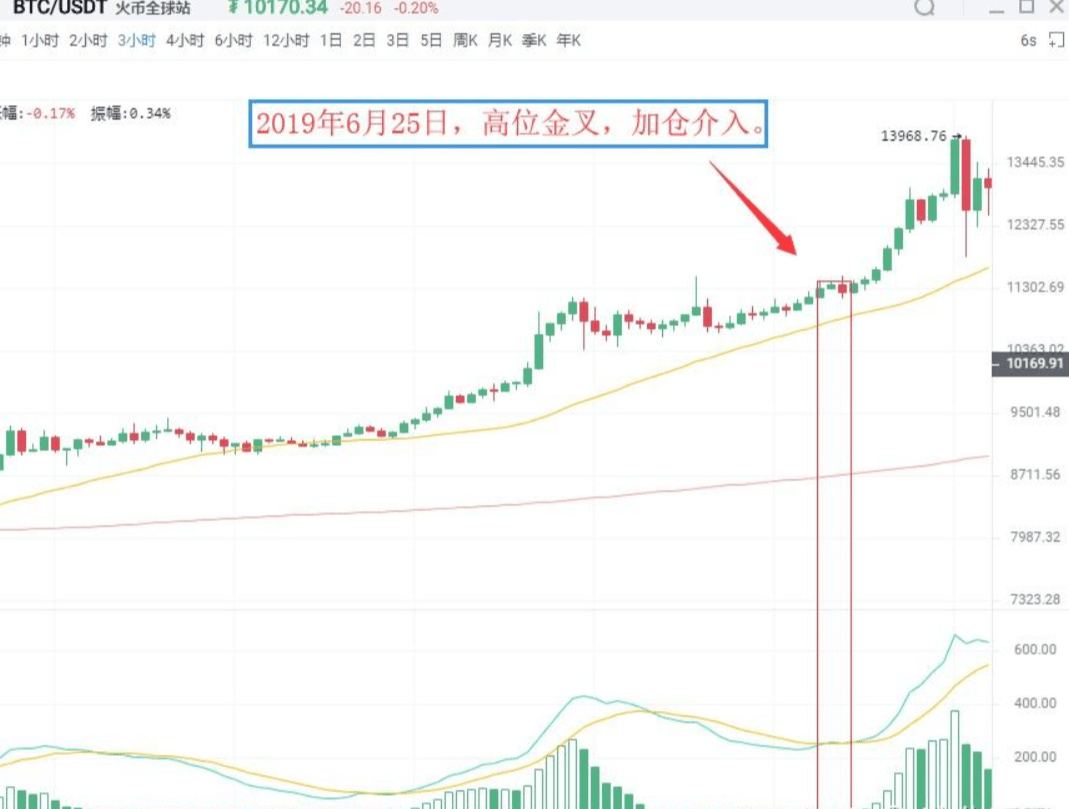
As shown in the figure above:
On June 25, 2019, the BTC 3-hour candlestick chart showed Bitcoin prices rising again after a period of consolidation. Meanwhile, the MACD indicator formed a golden cross at a high level. This indicates that the correction has ended and the price will resume its previous upward trend. Investors should seize this opportunity to increase their positions.
Case 4: Selling point of low-level death cross
A low-level death cross refers to a death cross that occurs far below the zero axis. This type of low-level death cross often occurs at the end of a rebound in a downtrend, and therefore serves as a sell signal. At this time, investors who are not in the market should wait and see. Those who are still holding positions and are deeply trapped can sell and buy back in after the price drops to reduce their costs.
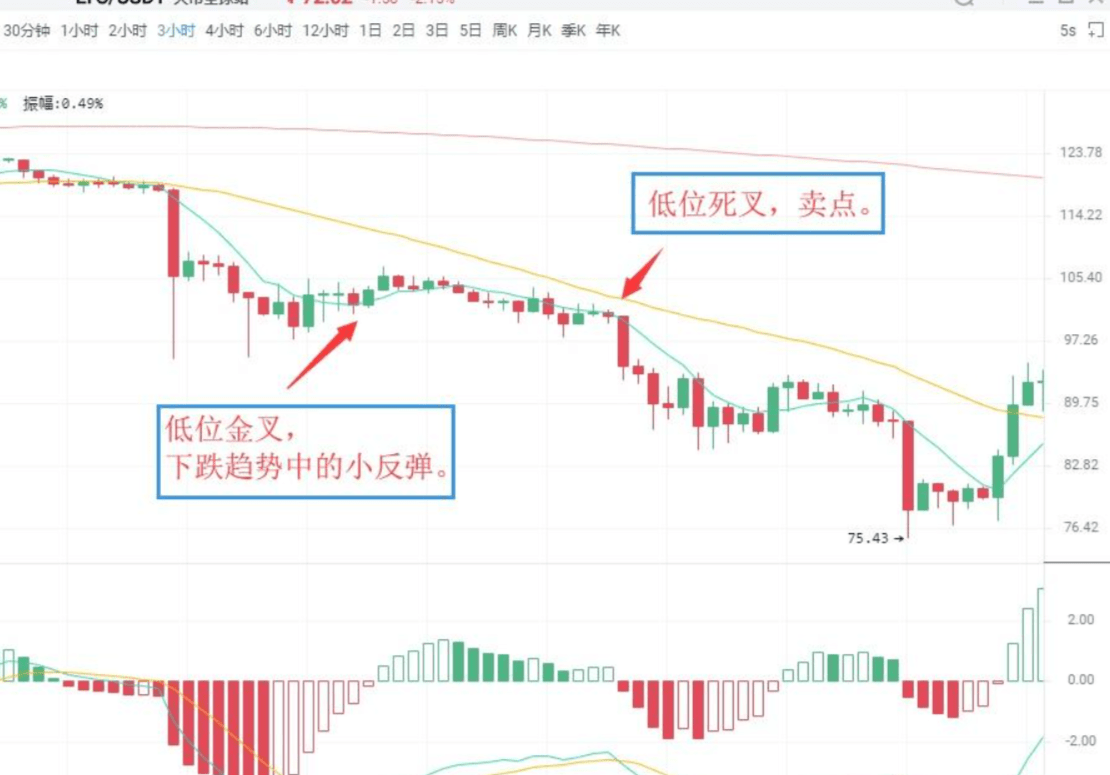
As shown in the figure above:
On July 14, 2019, the LTC 3-hour K-line chart showed that the MACD indicator of Litecoin had a low golden cross, and the price rebounded slightly, and then quickly fell.
Then, the MACD indicator forms a death cross below the zero axis, and the K-line begins a new round of decline. Spot investors can sell positions at the death cross position and then cover them to reduce the cost of holding positions.
Situation 5: Selling point of death cross near zero axis
If the previous market direction has been a downward trend, the cross formed when the DIFF line falls below the DEA line near the zero axis is called a death cross near the zero axis. It shows that the market has accumulated a lot of downward momentum near the zero axis. The appearance of a death cross indicates that the market's downward momentum has begun to be released, and the K-line will continue the original downward trend, which is a sell signal.
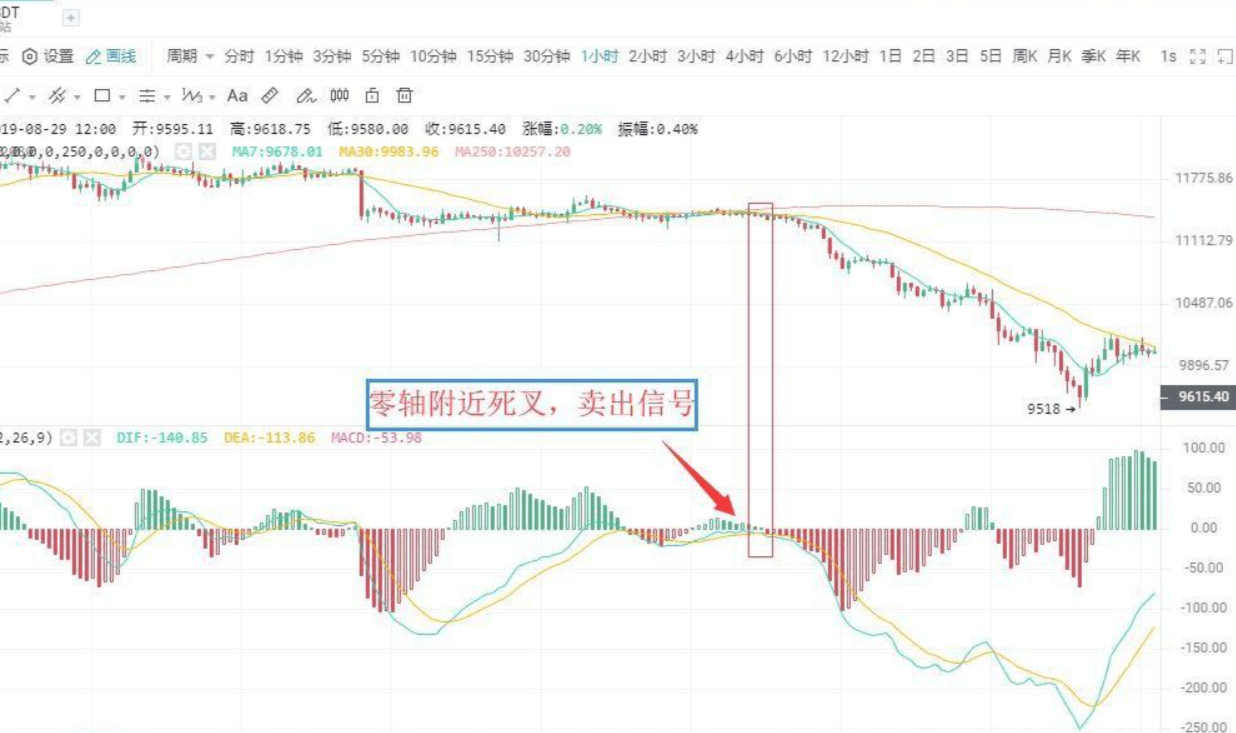
As shown in the figure above:
On August 12, 2019, the 1-hour BTC candlestick chart showed Bitcoin's DIFF line falling below the DEA line near the zero axis, forming a death pattern. This indicates that the market is beginning to release downward momentum, a sell signal. Investors should decisively sell their positions, otherwise they will be deeply trapped.
Situation 6: Selling point of high-level death cross
When the DIFF line breaks below the DEA line well above the zero axis, the crossover is called a high-level death cross. This type of death cross is sometimes accompanied by a MACD top divergence. This manifests itself as: while the price continues to rise and hit new highs, the MACD DIF and DEA lines no longer rise or advance continuously, but instead diverge from the price trend, moving downwards.
Above the zero axis, the DIF line crosses the DEA line to form a downward cross trend pattern, which is a death cross and a relatively reliable sell signal.
As shown in the figure above:
On August 23, 2019, TRX 1-hour K-line chart showed that after a wave of upward movement, the price of Tron continued to hit new highs, but the DIF and DEA lines stopped rising continuously, forming a death cross, a sell signal.
4. Divergence between MACD and K-line
Divergence is a term used in physics to describe momentum. In technical analysis, it's a highly successful and widely used analytical method. During a downtrend, when prices hit a new low but the indicator doesn't, this is called a bottoming divergence. This indicates that upward momentum is building and is a buy signal. During an uptrend, when prices hit a new high but the indicator doesn't, this is called a topping divergence. This indicates that downward momentum is building and is a sell signal.
I. Bottom Divergence
(1) Divergence between MACD-Histogram and DIFF Line
The bottom divergence between the DIFF line and the price refers to the situation in a downtrend where, when the price hits a new low, the DIFF line does not hit a new low. This indicates that during the price decline, the DIFF line's decline is smaller than the price's decline. The market's upward momentum is accumulating, and the price is about to stop falling. The probability of rising in the next period of time is high.
The MACD-Histogram (MACD-Histogram), hidden behind the DIFF line, is a red and green MACD-Histogram line. Divergence between the MACD-Histogram and price is a key use of the MACD indicator and is widely used in real-world trading. A bottom divergence between the MACD-Histogram and price occurs when prices repeatedly hit new lows, but the MACD-Histogram fails to follow suit. This indicates that upward market momentum is building, and prices are about to stop falling, with a high probability of further increases.
When a bottom divergence occurs, investors can grasp the specific buying point in two ways.
(2) Specific timing for buying people
The bottom divergence between the DIFF line, MACD-bar chart, and price isn't a specific moment in time, but rather a pattern that occurs over a period of time. However, when investors buy, it's a specific moment, indicating that prices are about to stop falling. Therefore, to identify the right time to buy, when the DIFF line, MACD-bar chart, and K-line chart show bottom divergence, investors must combine bottom divergence with other technical analysis tools to identify specific buying points.
First: Bar color change or MACD golden cross
A color change in the bar indicates that upward market momentum is gaining momentum. This generally occurs after a shortening of the bar, though it occurs later, but is more reliable. When a bottom divergence occurs and the bar changes color smoothly or forms a golden cross, investors can buy.
As shown in the figure above:
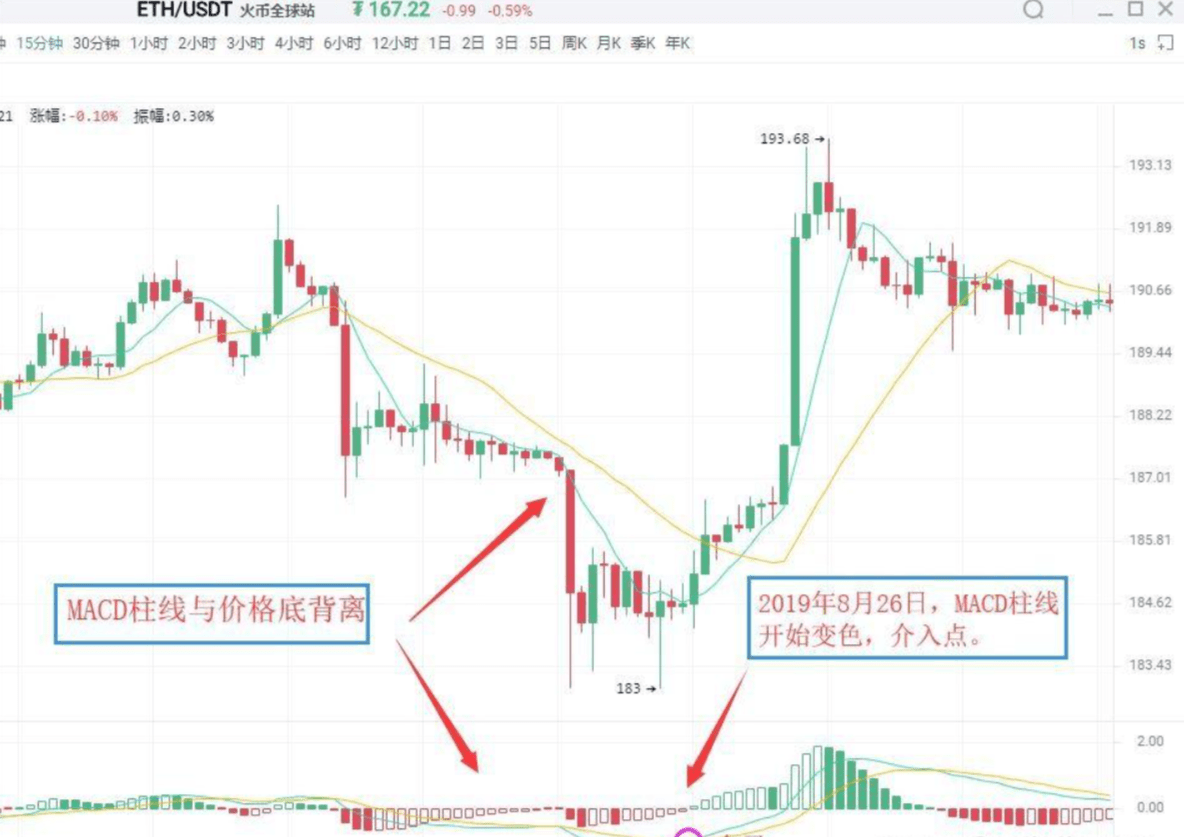
On August 26, 2019, the 15-minute candlestick chart of Ethereum (ETH) showed that while the price of ETH was falling, it hit a new low. However, the MACD-Histogram did not, forming a bottom divergence between the histogram and the price. This indicates that upward momentum is beginning to accumulate in the market, and the price is likely to rise again.
Then the bar changes color. The two buy signals appearing one after another are superimposed on each other, which increases the reliability of the rising significance. Investors can intervene when the bar changes color.
Second: Combine with other technical analysis tools and K-line reversal patterns
The bottom divergence is combined with the K-line reversal pattern, such as the "single needle bottoming" and the "three red soldiers" at the bottom. This is the specific application of the "multi-indicator coordination principle."
As shown in the figure above:
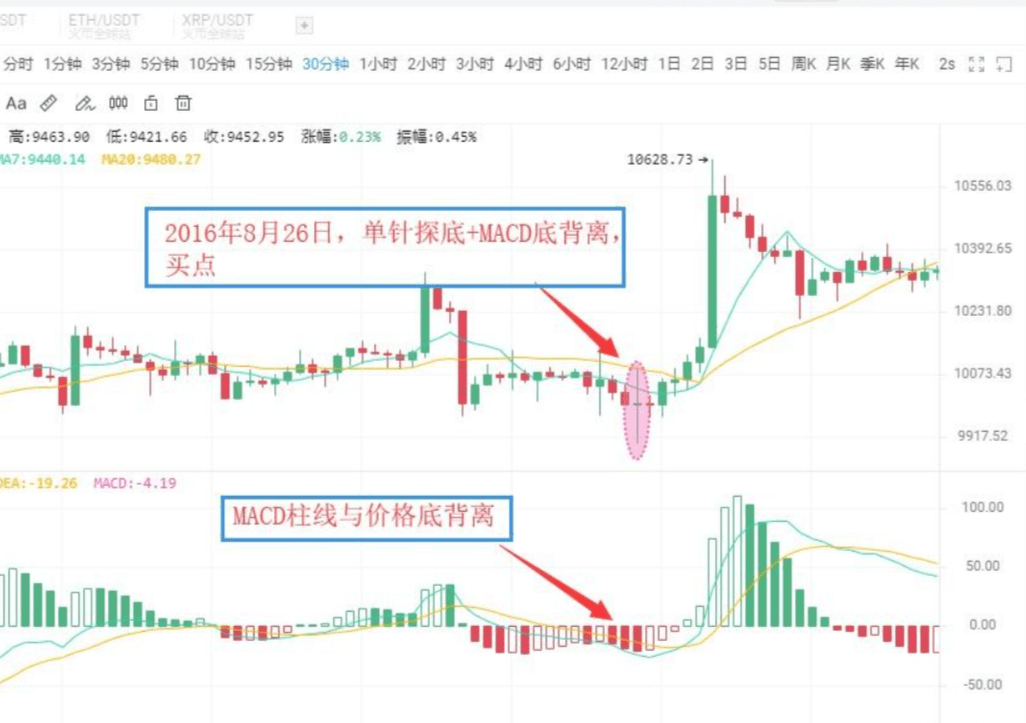
On August 26, 2016, the BTC 30-minute candlestick chart showed that the price of Bitcoin hit a new low, but the MACD bar line did not hit a new low, forming a bottom divergence pattern between the bar line and the price, indicating that the market's upward momentum continued to increase.
As the price stopped falling, a buy signal of "MACD bar line divergence from price bottom + K line single needle bottoming" was formed. After that, the price showed a wave of upward trend.
Divergence between working and top
(1) Divergence between MACD bar and DIFF line
A divergence between the MACD-Histogram and the K-line occurs when, during an upward trend, the price hits a new high, but the MACD-Histogram fails to do so. This indicates that downward momentum is building in the market, and prices could fall at any time.
A top divergence between the DIFF line and the K-line occurs when, during an uptrend, the price reaches a new high, but the DIFF line fails to reach a new high. This indicates that downward momentum is building in the market, and prices are likely to experience a further decline.
(2) Specific selling timing
Similar to bottom divergence, in actual operation, based on the principle of multi-indicator coordination, investors can combine the following methods to make the sell signal more specific.
First: Bar color change or MACD death cross
After a top divergence between the MACD-Histogram and the K-line forms, if the bar suddenly shortens significantly, it indicates that the market is beginning to release downward momentum. Investors should be careful to sell immediately. A change in the color of the MACD-Histogram indicates that the market's downward momentum has taken hold. This usually occurs after the bar continues to shrink. If the bar changes color after a top divergence between the MACD-Histogram and the K-line, or if the MACD shows a dead pattern, investors should exit the market immediately.
As shown in the figure above:
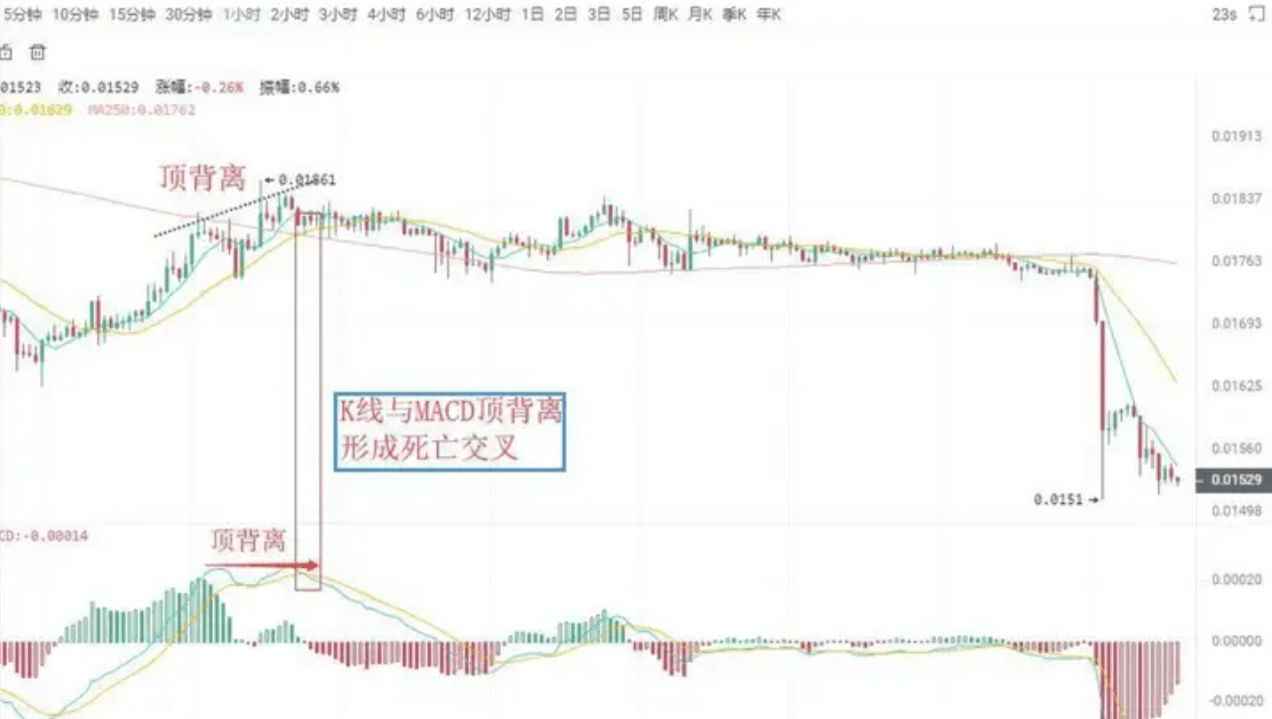
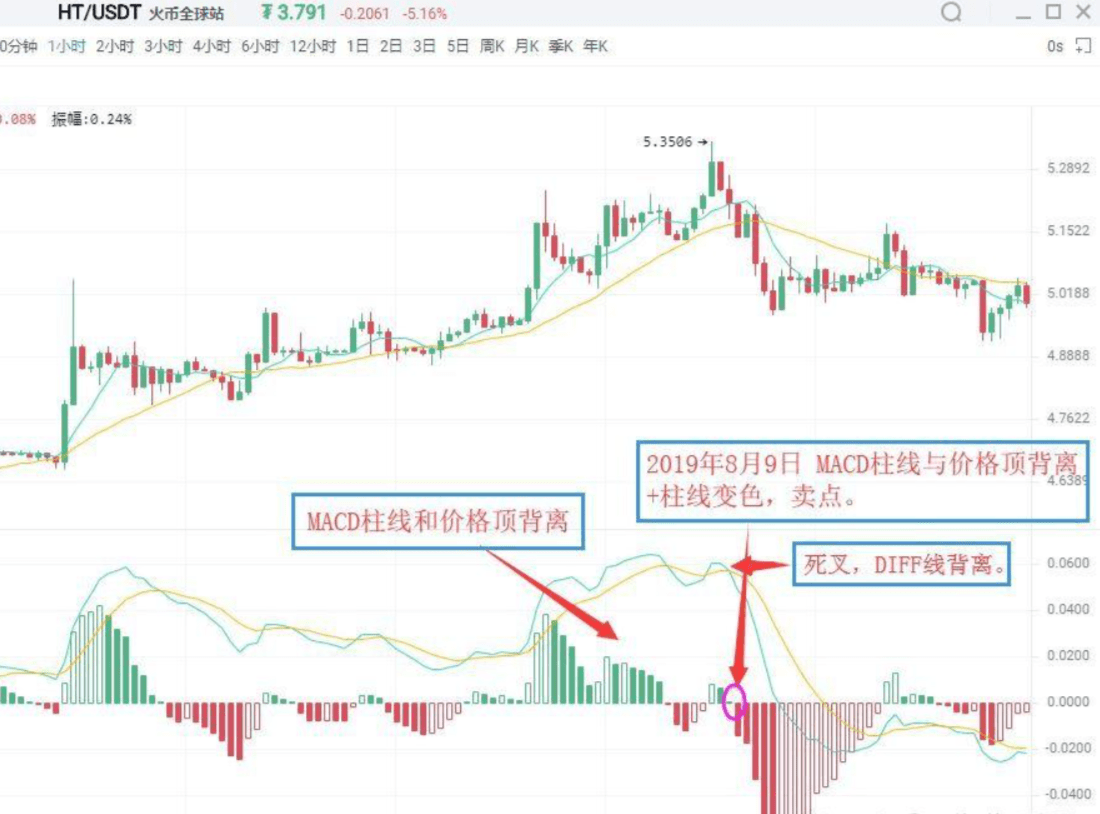
On August 9, 2019, the HT 1-hour candlestick chart showed Huobi's price reaching a new high, but the MACD histogram failed to reach a new high, forming a top divergence between the histogram and the price. This indicates that downward momentum is beginning to accumulate in the market, and the price may fall at any time.
Subsequently, the MACD line turns from red to green, issuing a sell signal of "divergence between the line and the price top + color change of the line". Investors should pay attention to exiting the market in time.
Second: Combine with other technical analysis tools and K-line reversal patterns
When MACD-bars diverge from prices, if other technical analysis tools also generate sell signals, the reliability of the market's sell signal increases significantly. Investors should be cautious about exiting the market immediately. Common examples of such sell signals include "a divergence between MACD-bars and prices combined with a K-line reversal pattern."
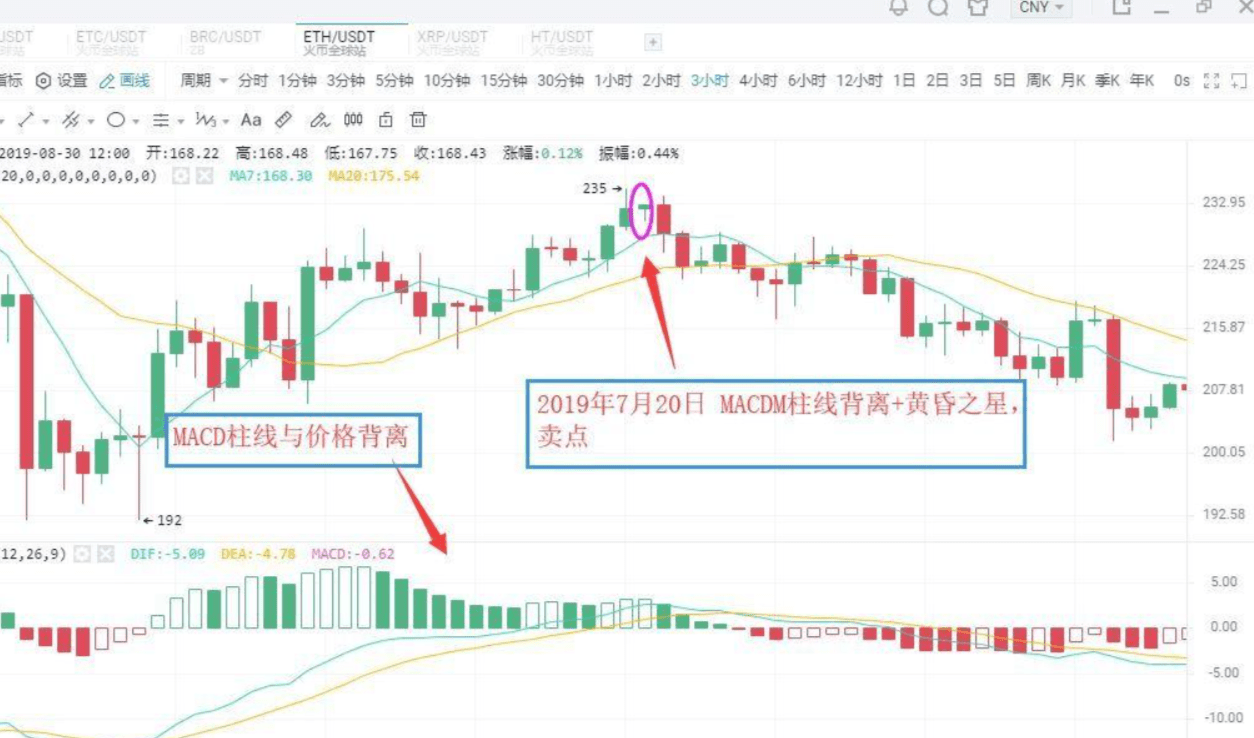
As shown in the figure above:
On July 20, 2019, the ETH 3-hour candlestick chart showed Ethereum prices hitting a new high, but the MACD bar chart did not, forming a top divergence between the bar chart and the price. This indicates that the market's downward momentum is increasing and the price may experience a wave of downward movement.
Subsequently, the MACD histogram gradually shortened, and the K-line formed an evening star + bearish pattern. Investors should pay attention to exiting the market in time, and then the K-line showed a large downward trend.
Attachment:
Evening Star: During an upward candlestick pattern, a long bullish candlestick appears first, followed by a shorter candlestick (either bullish or bearish) the next day. This is often compared to a star, representing the core of the candlestick pattern. The third candlestick is a long bearish candlestick, extending deep into the core of the first. The Evening Star signals a price peak and subsequent decline, with some predicting it with an accuracy rate exceeding 80%.
(Regarding some K-line patterns of peaks and bottoms. We will have several special courses to explain in depth later, please continue to pay attention)
5. Modification of MACD parameters
One of the drawbacks of the MACD indicator is that it reacts slowly to price changes, which sometimes results in less than ideal buy and sell prices. One way to improve this is to change the indicator parameters to make the MACD indicator more responsive to market trends, thereby allowing for more ideal buy and sell prices.
In commonly used market software, the default parameters of the MACD indicator are 12/26/9. Under such parameter settings, the MACD indicator's response to price changes often has a significant lag.
The lag of the MACD indicator can be addressed by adjusting its parameters. Common parameter combinations include 5/34/5 and 5/10/30. Investors can also experiment and explore more in practice.
Position Management
Whether in the stock market or the cryptocurrency market, if you manage your positions well, you will outperform most people.
Whether it is spot or contract, how you manage your positions directly determines your risk control level, average holding price and the final profit size. This can be said to be the most important point besides direction and mentality.

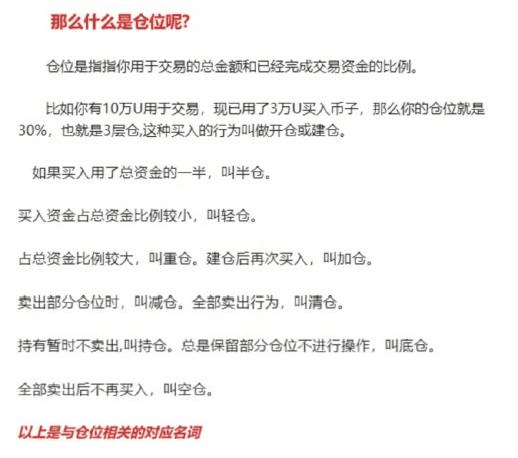
What is position management?
Position management refers to the specific plans you set for opening, increasing, reducing, and liquidating positions when you decide to trade cryptocurrencies. Good position management is one of the most important ways to mitigate risk, minimizing losses and maximizing profits.
How should positions be managed? Are there any standards? One of the key reasons many traders fail is that they consider market analysis the be-all and end-all of trading, as if market analysis alone can determine success or failure. In reality, market analysis is only the most basic task; the real determinant of success or failure lies in the work that follows market analysis—the considerations after entering the market.
Position management encompasses both capital management and risk control. The word "position" shouldn't be taken as a literal definition; it more closely reflects when to add positions, how much to add, and where to reduce positions, and by how much. It's essentially a roadmap for "entering, increasing, reducing, and exiting a trade."
Then the complete transaction process should be
1. Market analysis, you can use any technical analysis.
2. Position management. After entering the market, you need to consider what might happen next. What should you do if you make a profit? Should you add to your position, exit with a full profit, or continue holding? What if your profits increase again? What should you do if you incur a loss? Should you stop loss, hold onto your position, or exit partially? What is the maximum loss required before exiting completely? Position management considers both risk and reward.
3. Strictly execute transactions. Once you have a clear plan in mind, you should start implementing it and not let market fluctuations disrupt your thinking.
4. Summarize transactions. After a transaction is completed, it is necessary to review the transactions in the previous period. The review samples should cover three market conditions: rising, falling, and volatile. Then, based on this, the market analysis, position management, and the execution of transactions can be improved and optimized.
We must first find an entry point based on our trading techniques, and this point must be a support line. When the market is above the support line, the trend is upward, and when the market falls below the support line, the trend is downward. More importantly, the support line is also the basis for defining potential risk. When the stop loss is placed below this support line, the potential risk range is determined. If the initial stop loss area below the support line is reached, you should exit the market or close most of your position first, and then gradually close fewer positions as the price continues to fall, until all positions are closed.
Therefore, the potential profit margin is above the support line. As the upward trend continues, the potential profit is theoretically unlimited. If the market rises after entering the market, we can hold our original position and wait for further gains, or gradually increase our position based on the existing position. We will use a trailing stop-loss based on market developments. If the market moves as expected, we should move the stop-loss closer to the cost price or below the support line with a certain margin. Trailing the stop-loss continuously reduces the risk margin in the market, effectively locking in floating profits.
When the price rises to a new support or resistance level and then starts to fall back, then the area below this support or resistance level is the position reduction area, at this time we need to gradually close all positions. To summarize: First, we need to find a support or resistance line of the cost price. When the price rises away from the cost line, we gradually increase our position, and the increase in position must be decreasing. When the price falls away from the cost line, we gradually reduce our position, and the reduction in position is also decreasing. Your position management technology must take into account both risk and return.

Six basic principles of position management:
First: Don’t operate with a full position, always keep a certain proportion of reserve funds:
Second: Buy and sell in batches to reduce risk, spread costs, and maximize returns. The advantage of buying in batches downwards and selling in batches upwards is that your average price is lower than others and your returns are higher.
Third: When the market is weak, you should hold a light position. In a bear market, it is best not to exceed half of the position. In a strong market, you can increase your position appropriately. In a bull market, the recommended maximum position is 8 layers, leaving 20% for short-term trading or reserve funds to deal with unexpected events.
Fourth: As the market changes, corresponding position adjustments should be made, and positions should be increased or decreased appropriately.
Fifth: When the market is sluggish, you can go short in the short term and wait for opportunities to come.
Sixth: Position Change: Keep strong currencies and sell weak currencies
The above 6 principles apply to both spot and futures contracts. If you still don’t understand, please read them carefully several times. Reviewing the old and learning the new will help you become a teacher!

Let's talk about the method of position management, which is to operate in batches
Batching refers to the act of dividing your investment into smaller portions to establish, increase, or decrease positions. Batching can be completed within a single day or over a period of time.
Why do we need to do these actions? Because the currency market is unpredictable, and rises and falls are high-probability events. No one can accurately predict short-term price fluctuations, so we must set aside enough funds to deal with unpredictable fluctuations.
If you go all-in without sufficient confidence, you could suffer huge losses if the market changes in the opposite direction. Therefore, you can reduce the risk of going all-in by trading in batches, which can spread the cost and is the basis for reducing costs and maximizing profits.
Next, let’s talk about how to batch: there are two types: equal batches and non-equal batches
The first method is the equal allocation method, also known as the rectangular trading method. This involves dividing funds into several equal parts and buying or selling them sequentially, maintaining the same proportion each time. Three or four equal parts are commonly used. For example, buy 30% first. If you start to make a profit, buy another 30%. If you don't make a profit, don't invest any new funds for the time being. When the price of the currency reaches a certain high point or the market turns, reduce your position and sell in batches.
Second: Non-equal distribution, which means buying or selling funds in different proportions, such as 1:3:5, 1:2:3:4, 3:2:3, etc.
The shapes produced according to the proportions are divided into: diamond, rectangle, hourglass, etc., and the pyramid-shaped buying and selling method is commonly used.
Third: Using different methods to compare with the same funds and positions
Pyramid: 1000 for 5 layers, 1100 for 3 layers, 1200 for 1 layer, average price 1055
Inverted pyramid: 1000 for 1st floor, 1100 for 3rd floor, 1200 for 5th floor, average price 1144
Equally divided rectangle: 1000 for 3 layers, 1100 for 3 layers, 1200 for 3 layers, average price 1100
The price rises to 1200 and the profits are: Pyramid 145, Inverted Pyramid 56, Rectangle 100
The price drops to 1000 and the losses are: Pyramid +55, Inverted Pyramid -144, Rectangle -100
By comparison, the pyramid structure minimizes costs and offers greater profits when prices rise. However, it carries greater risk when prices fall. The inverted pyramid structure, on the other hand, is the opposite. If the price falls to 1,000, the inverted pyramid structure loses 144. In practice, it's more reasonable to use a positive pyramid structure for buying and an inverted pyramid structure for selling.
After the currency price has fallen sharply and has reached the bottom but we are not sure whether it has reached the bottom, if we buy at this time, we are afraid of being trapped by further decline. If we do not buy, we are worried that the market will reverse and rise and we will miss the opportunity. In this case, we can use the pyramid position building method.
For example:
If a certain currency falls to 10U, buy 20% of the position, and then buy 30% of the position after the price falls to 8U. The average cost at this time is 8.6U.
If the market continues to fall to 5U and then enters 40%, the average is 6.5U.
If the price rebounds to 6.5 yuan, the principal is protected. If it rebounds to 10U, it is equivalent to a profit of 3.5U. However, if you buy all the stocks at 10U, you will just get out of the loss when the price returns to 10 yuan.
As the price of a currency rises, the lower the price, the larger the buy position should be. As the price gradually rises, the position should be gradually reduced. This buying method is considered a right-side position building. This cost is relatively safe. Even if the market falls, as long as it does not fall below the holding cost, there is no need to panic.
This method has a heavy initial position, so the requirements for first-time entry are relatively high. It requires a grasp of market fluctuations and is suitable for technical players.
The inverted pyramid selling method is the opposite of the upright pyramid, with a wider top and narrower bottom, resembling a funnel. As the price of a coin rises, the amount of coins held is gradually reduced, meaning the number of coins sold increases as the price rises. This is the method of reducing or liquidating a position.
The core of position management is the above points. After understanding them, I believe that in the future, whether it is opening a spot position or a contract position, you will have an idea.
If you've read this far, I'm sure you're a huge fan of the community!
Now let's do some actual combat teaching! (The following text will be explained in plain language, I'm afraid you won't understand!)
Spot warehouse management
Example: If you have 100,000 U, you need to divide it into ten parts! Prepare to buy ten coins! Allocate 10,000 U to each coin! The same amount of money is required for each entry!
For example: Open a position in XX currency, 50% of the position at XX price, and add 50% of the position at XX price. The 50% position means that according to the standard of allocating 10,000U to each currency, 5,000U is reserved for opening a position and 5,000U is reserved for adding a position.
The biggest taboo in spot trading is to hold a large position in the stocks you are optimistic about and a small position in the stocks you are not optimistic about!
This coin is good. I will buy more, 30,000 U,
This coin is average, I bought 10,000 U
If you don't follow this position, then a problem will occur. If the 30,000 yuan you bought in a heavy position loses 10%, that's 3,000 U. Then, even if the 10,000 yuan you bought in a light position rises 10%, that's only 1,000 U, so you still lose money!
The above is the plain language of spot trading. If you don’t understand it, read it several times.
Contract position management
ETH position allocation is calculated by number!
The maximum number of positions held with 1000u principal is 5
The maximum number of positions held with 3000u principal is 10
The maximum number of positions held with a 5000u principal is 20.
The maximum number of positions held with 10000u principal is 30.
The maximum number of positions held with a capital of 30000u cannot exceed 50
The maximum number of positions held with a 50000u principal is 100.
BTC position allocation is calculated based on the number!
The maximum number of positions held with a principal of 1000u cannot exceed 0.5
The maximum number of positions held with 3000u principal is 1
The maximum number of positions held with a capital of 5000u is 2
The maximum number of positions held with 10000u principal is 3
The maximum number of positions held with a capital of 30,000u is 5.
The maximum number of positions held with a capital of 50,000u is 10.
Contracts are actually the same as spot trading. The initial principal for each order is the same, and the number of orders placed each time is the same. Take profits when you should and losses when you should. Treat yourself as a trading machine! In the end, God K will conquer you with his strength!

Finally, let me share some of my personal suggestions on how to do a good job in trading.
First: Technical aspects, including technical indicators, K-line patterns, trading volume, trend judgment, bull-bear differentiation, buying and selling points, support and resistance judgment, and the use of volume, price, time and space.
This varies from person to person. Some people don't understand technology and have no interest in it.
Second: Fundamental analysis, including relevant macroeconomics, policies, supervision, the project itself, etc.
Third: News, good or bad news, operate when the news and fundamentals are good.
Fourth: Time cycle: intraday short-term, medium-short-term, medium-long-term, and long-term (trend trading). Confirm the trading cycle and achieve consistency in the operation cycle. For example, when doing long-term trading, do not frequently make short-term buy and sell operations. When doing long-term trends, the adjustment fluctuations in the middle are acceptable as long as there is enough room and it is a mainstream currency, and the price will rise again.
Fifth: Control your mentality. Remember not to waver. Once you have made a plan, implement it without any compromise.
Sixth: Strictly stop loss. Stop loss is the worst plan. When the market turns around, do not hesitate to stop loss and escape the top.
These are my personal experiences! I hope they are helpful to you all!
There is a saying that I strongly agree with: the boundaries of knowledge determine the boundaries of wealth, and people can only earn wealth within the boundaries of their knowledge.
You must have a good mentality when trading cryptocurrencies. Don't let your blood pressure soar when there is a big drop, and don't get carried away when there is a big rise. It is more important to lock in your profits.
For people who don’t have many resources, being down-to-earth is the irrefutable way of survival.
A single tree cannot make a boat, and a single sail cannot sail far! In Erquan, if you don’t have a good circle and first-hand information about the cryptocurrency circle, then I suggest you follow me and I will help you get ashore for free. You are welcome to join the team!!! #币安HODLer空投MIRA #加密市场回调 $ETH


