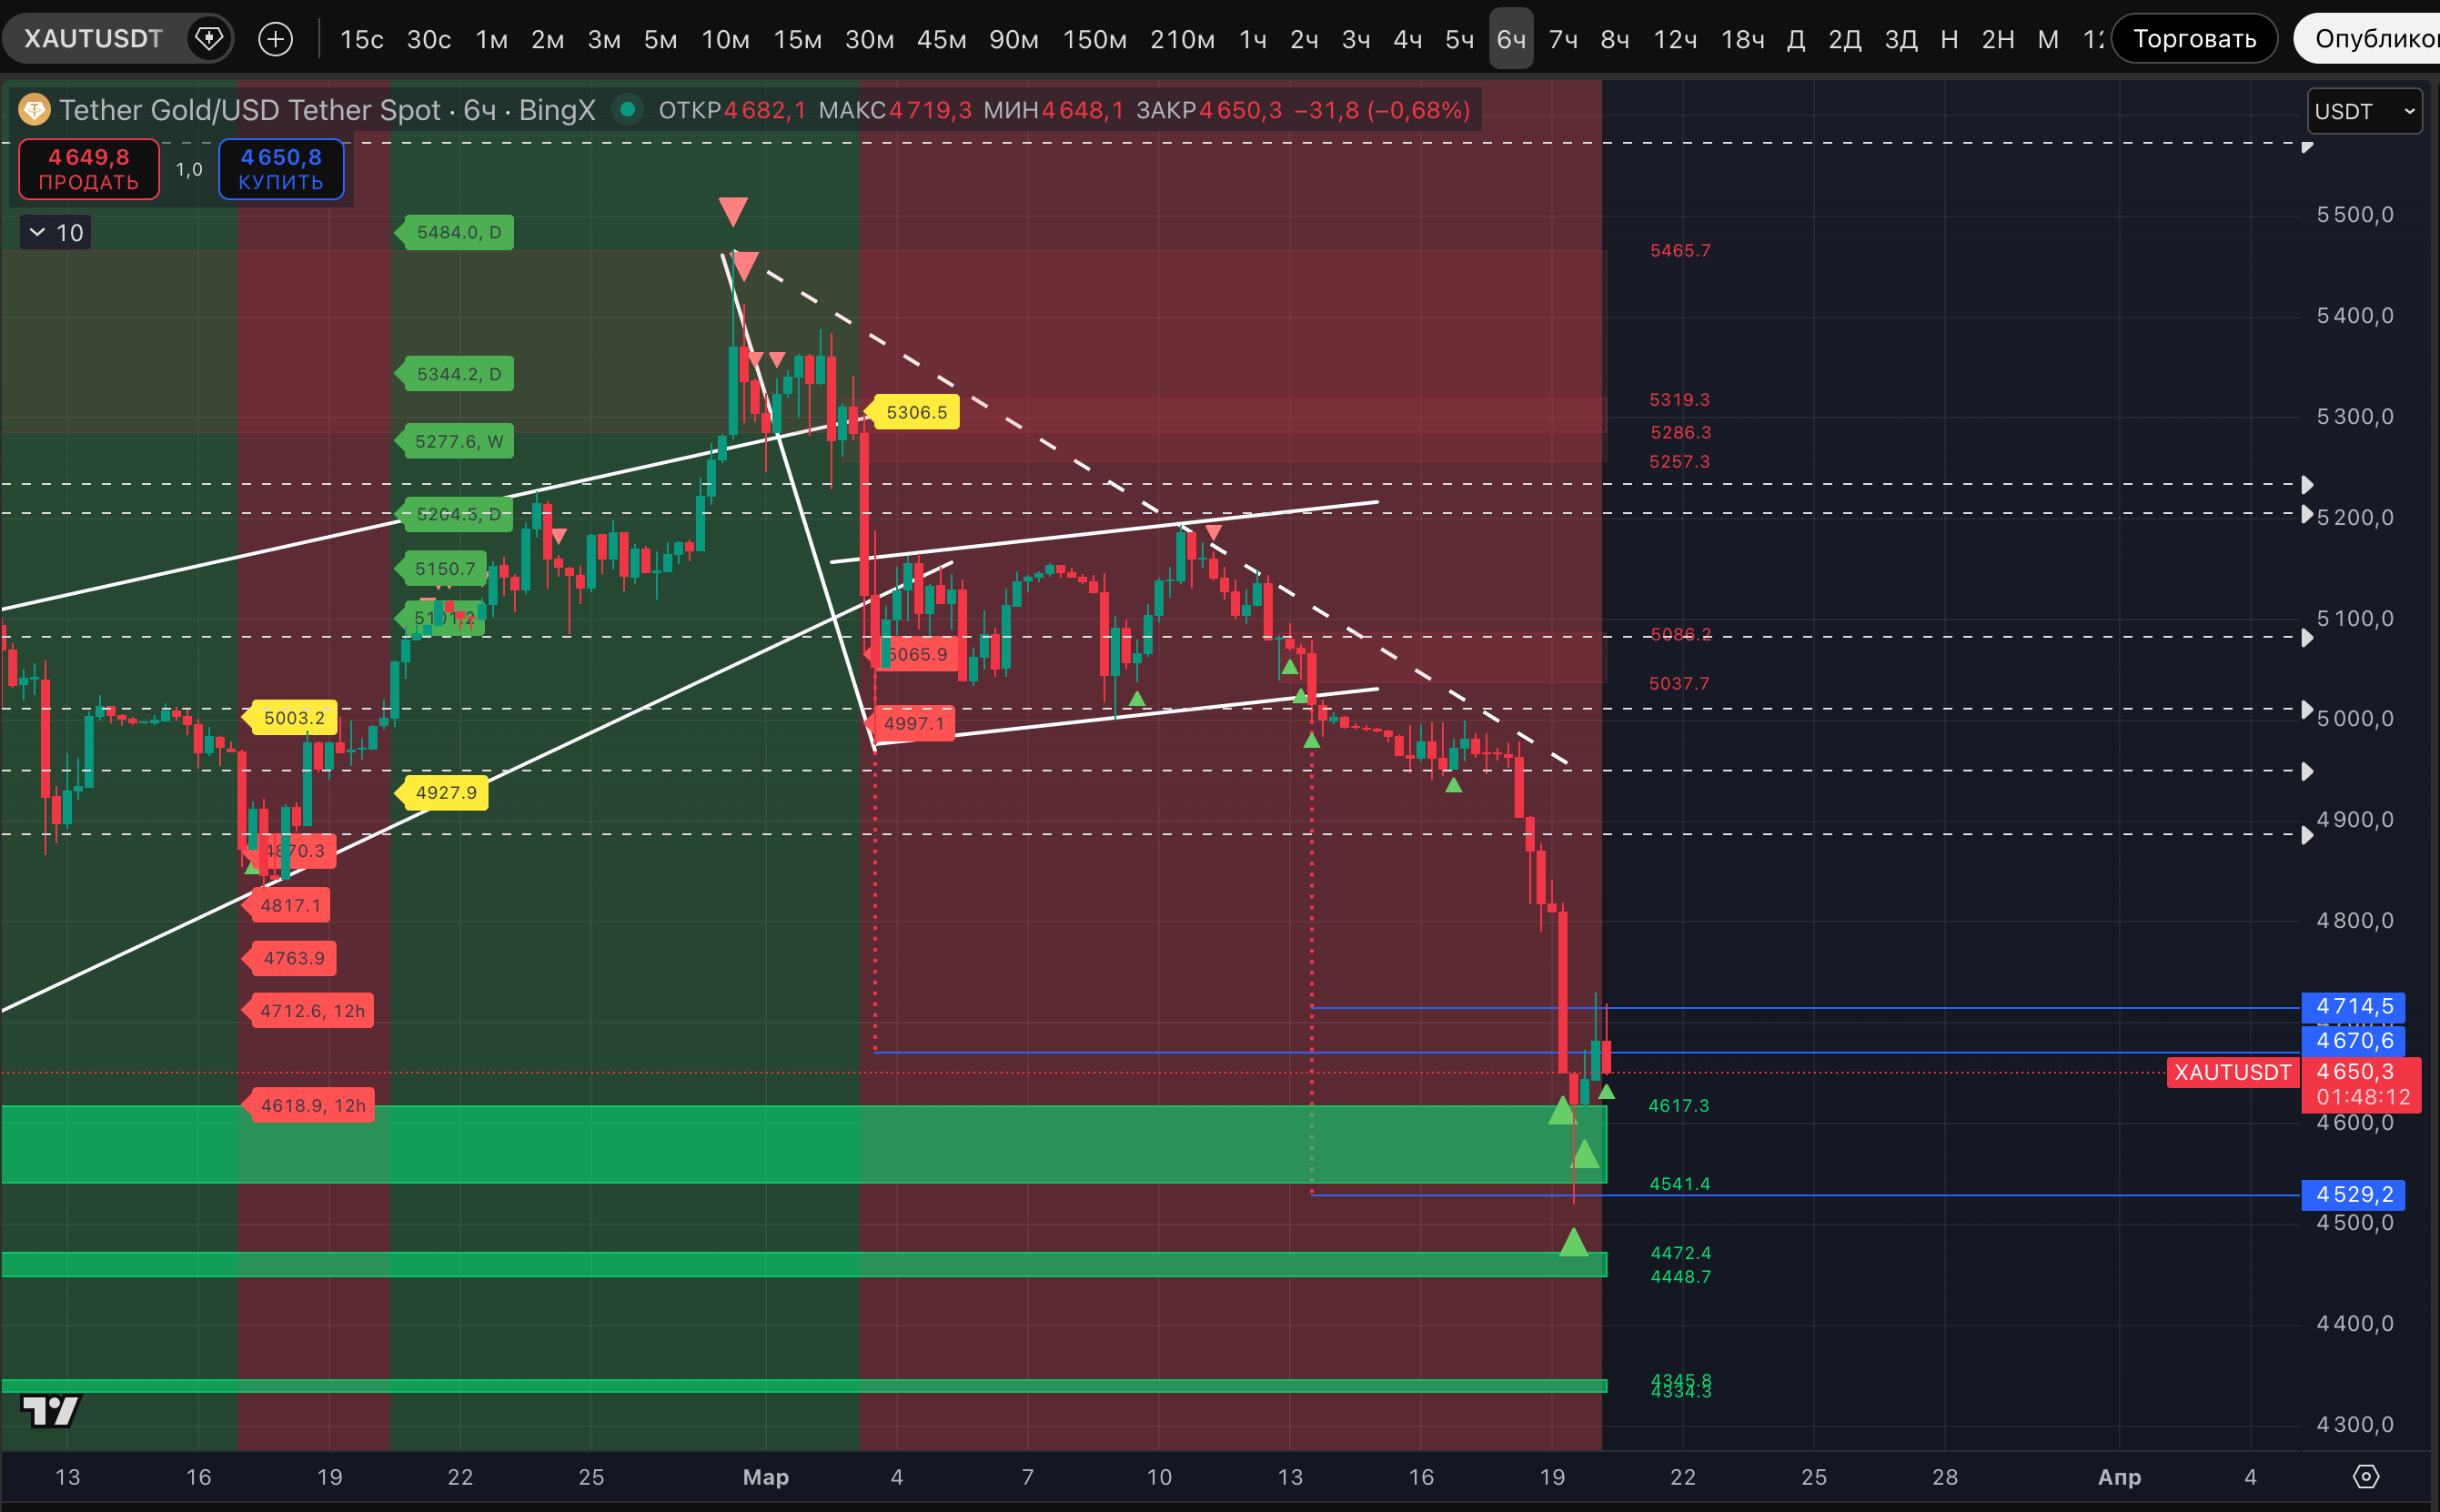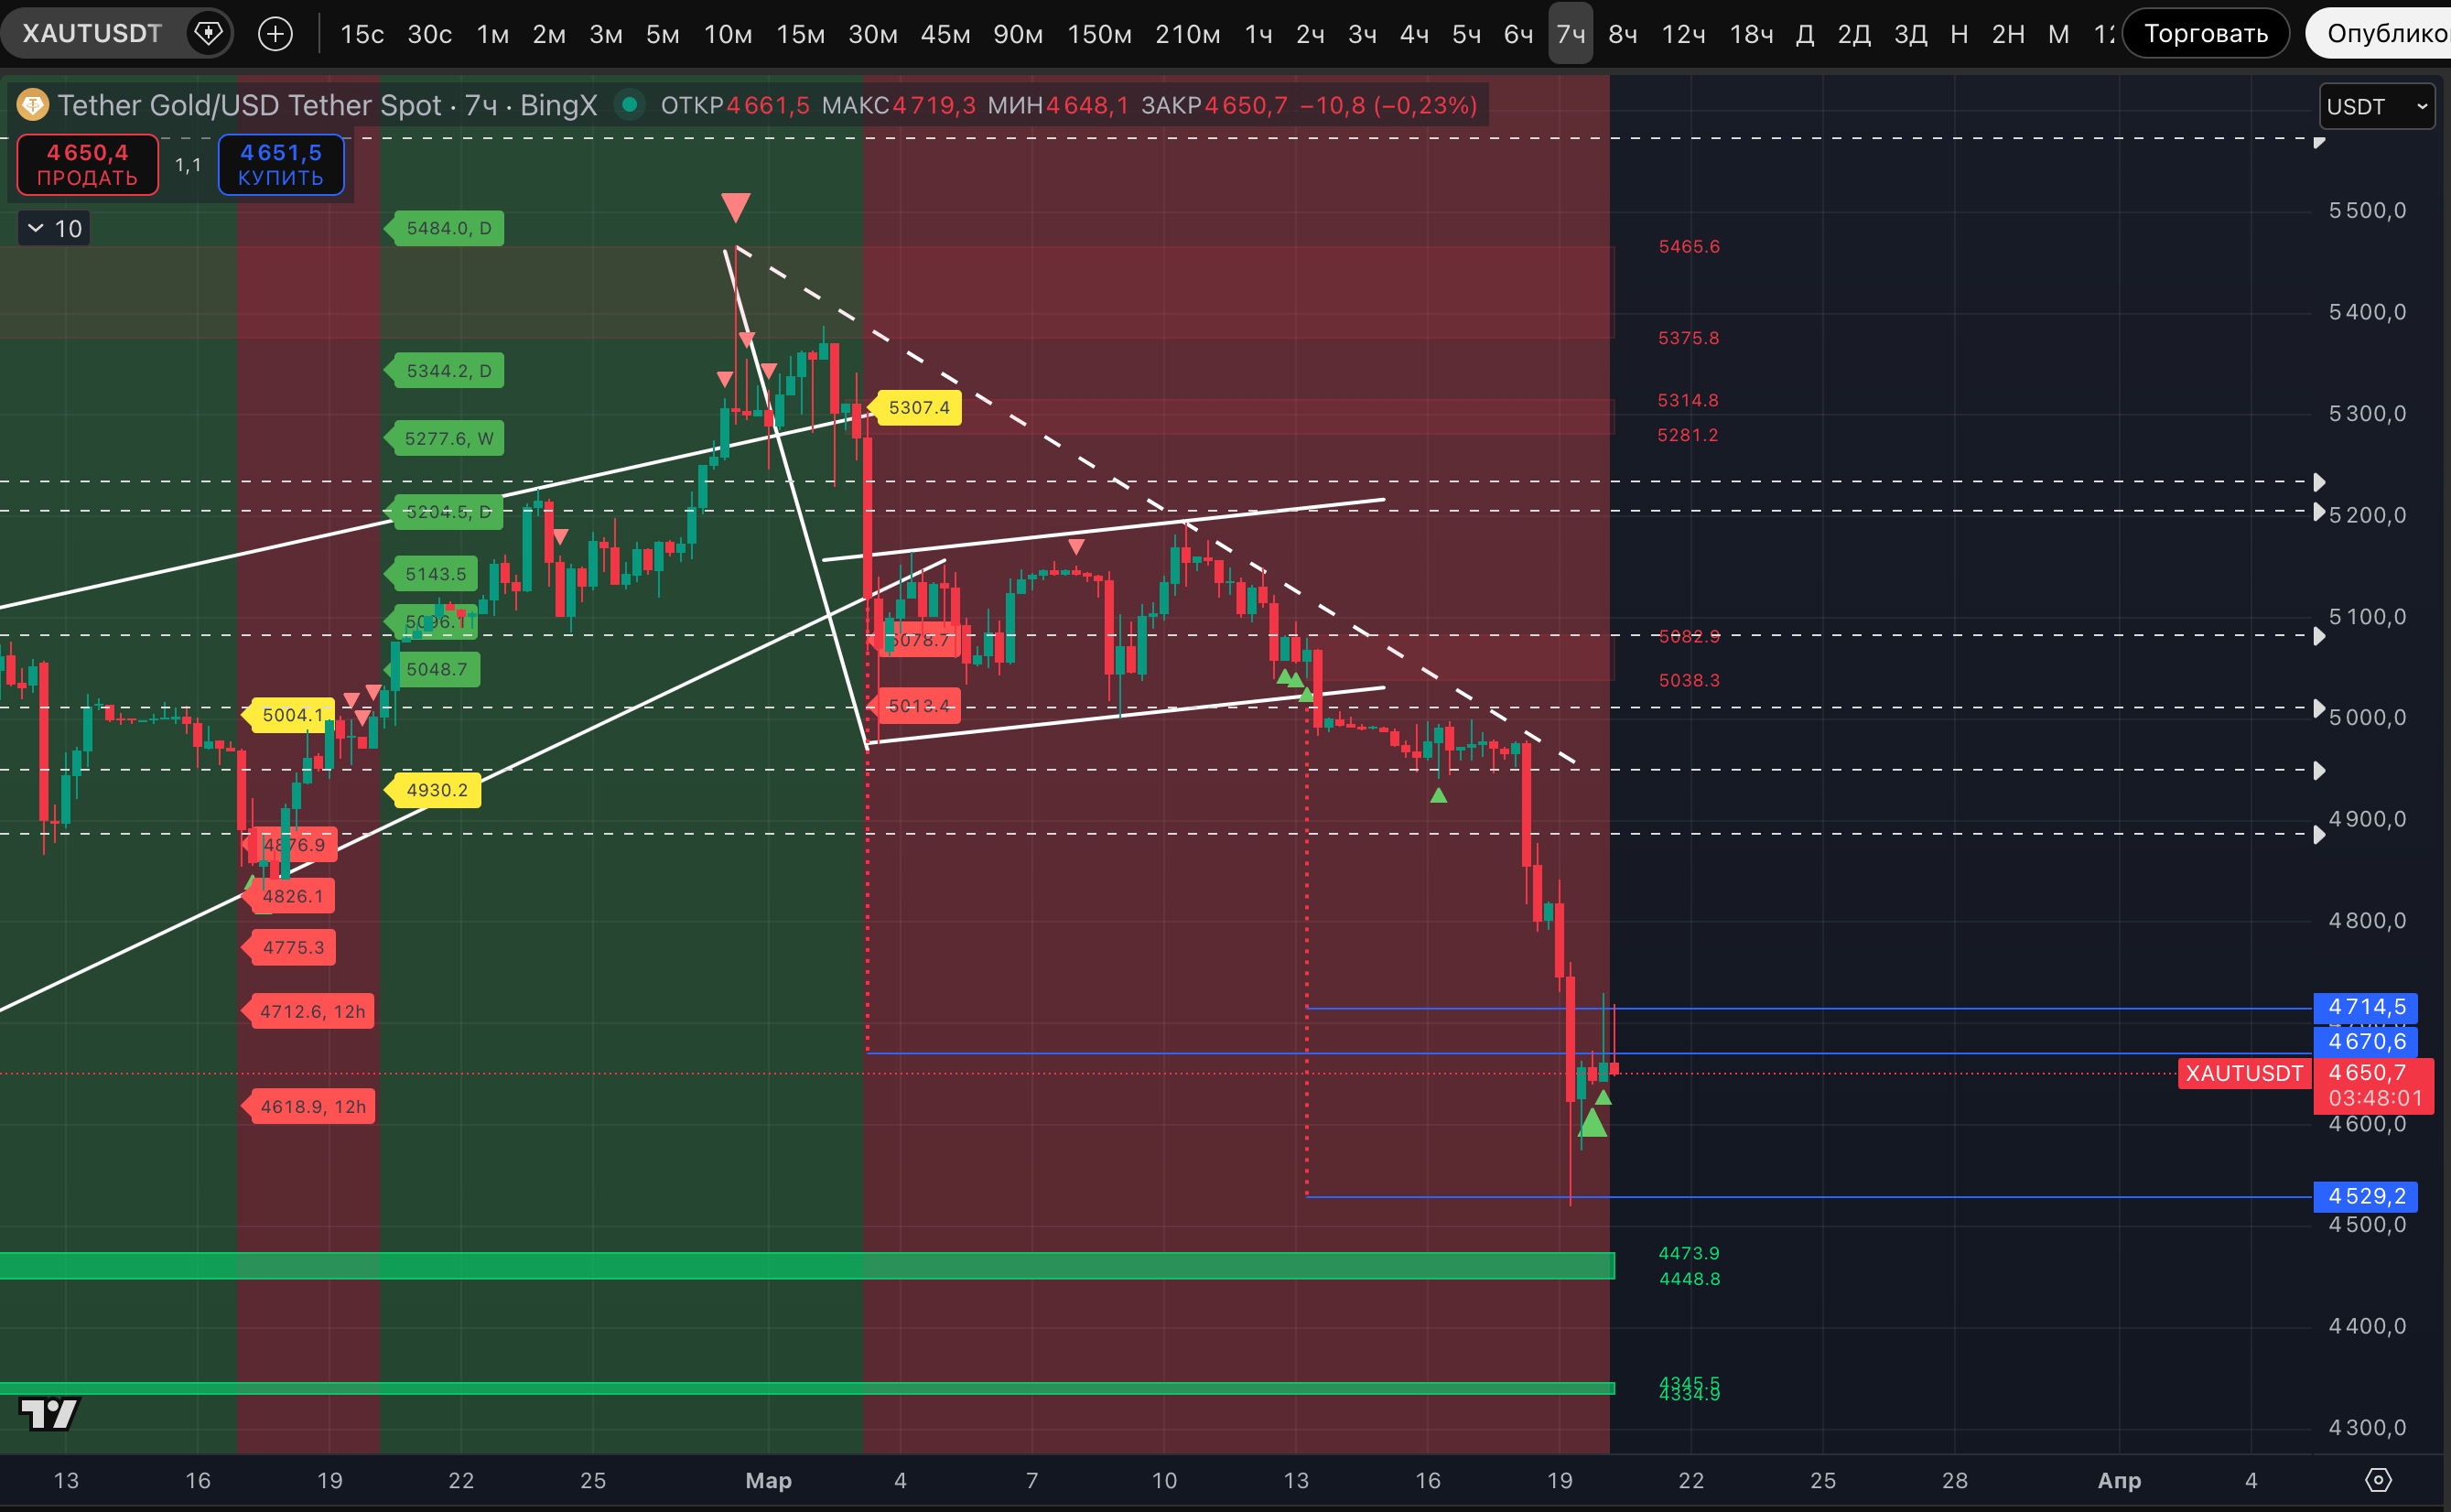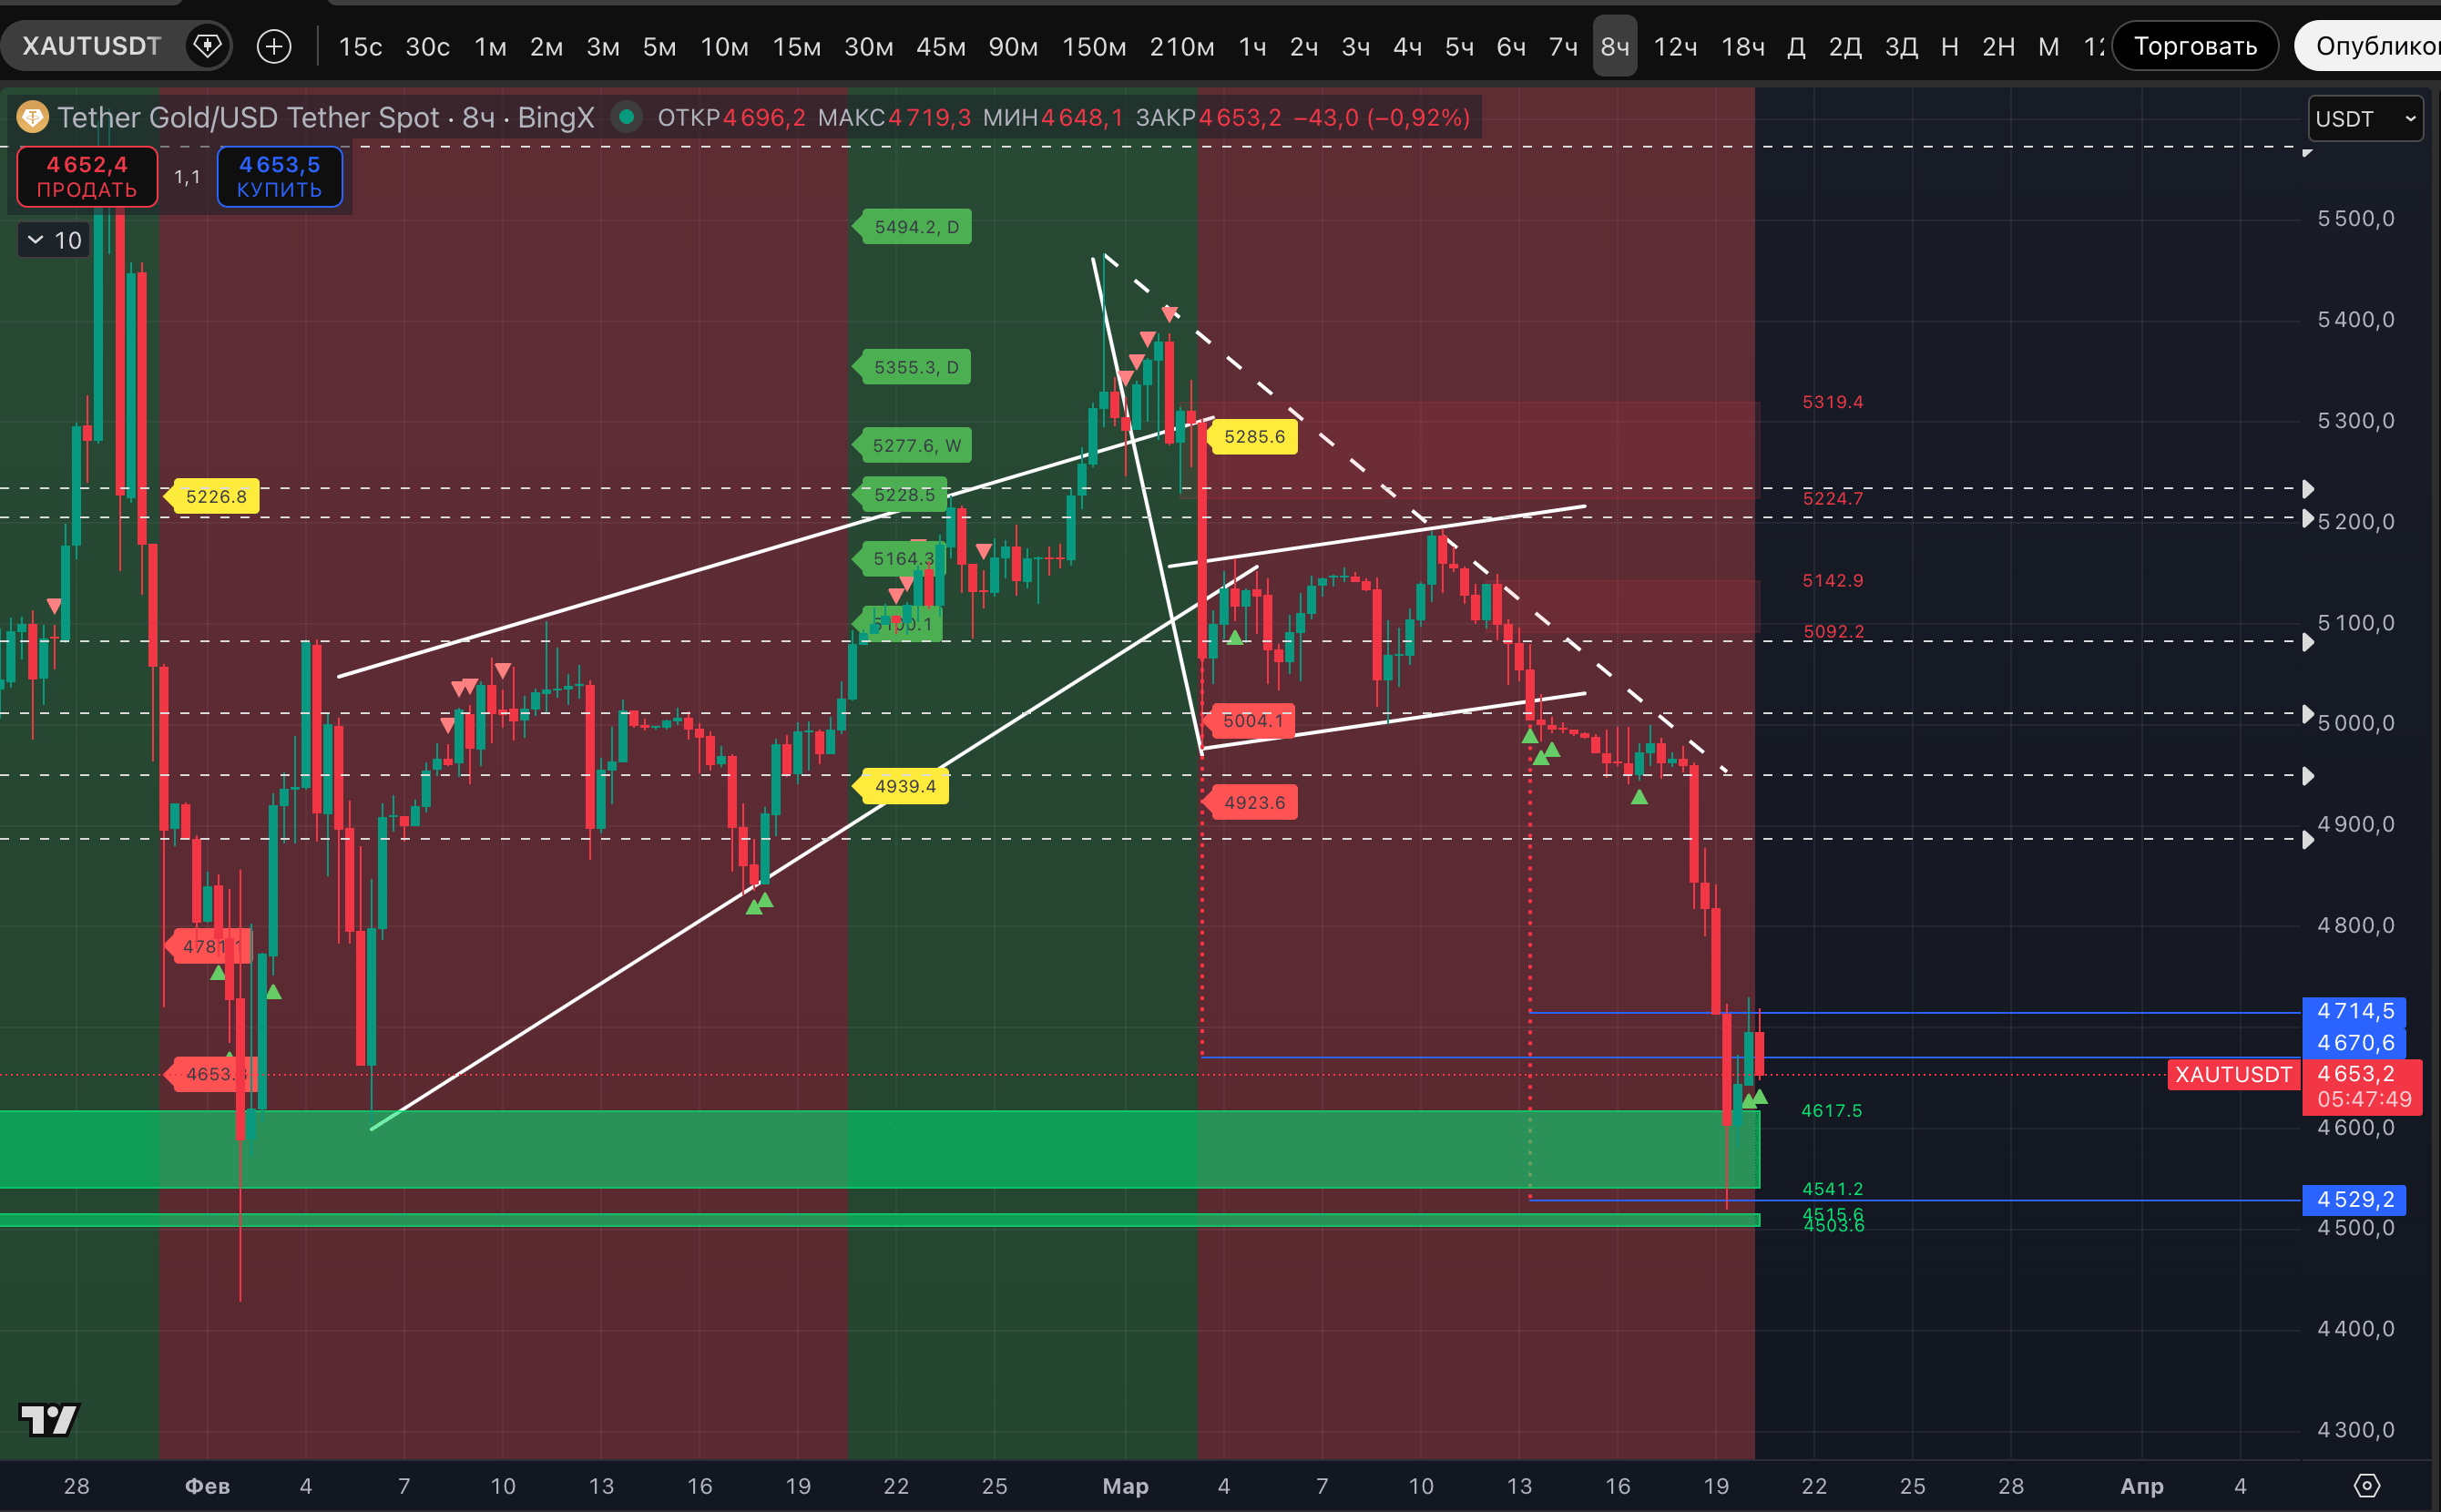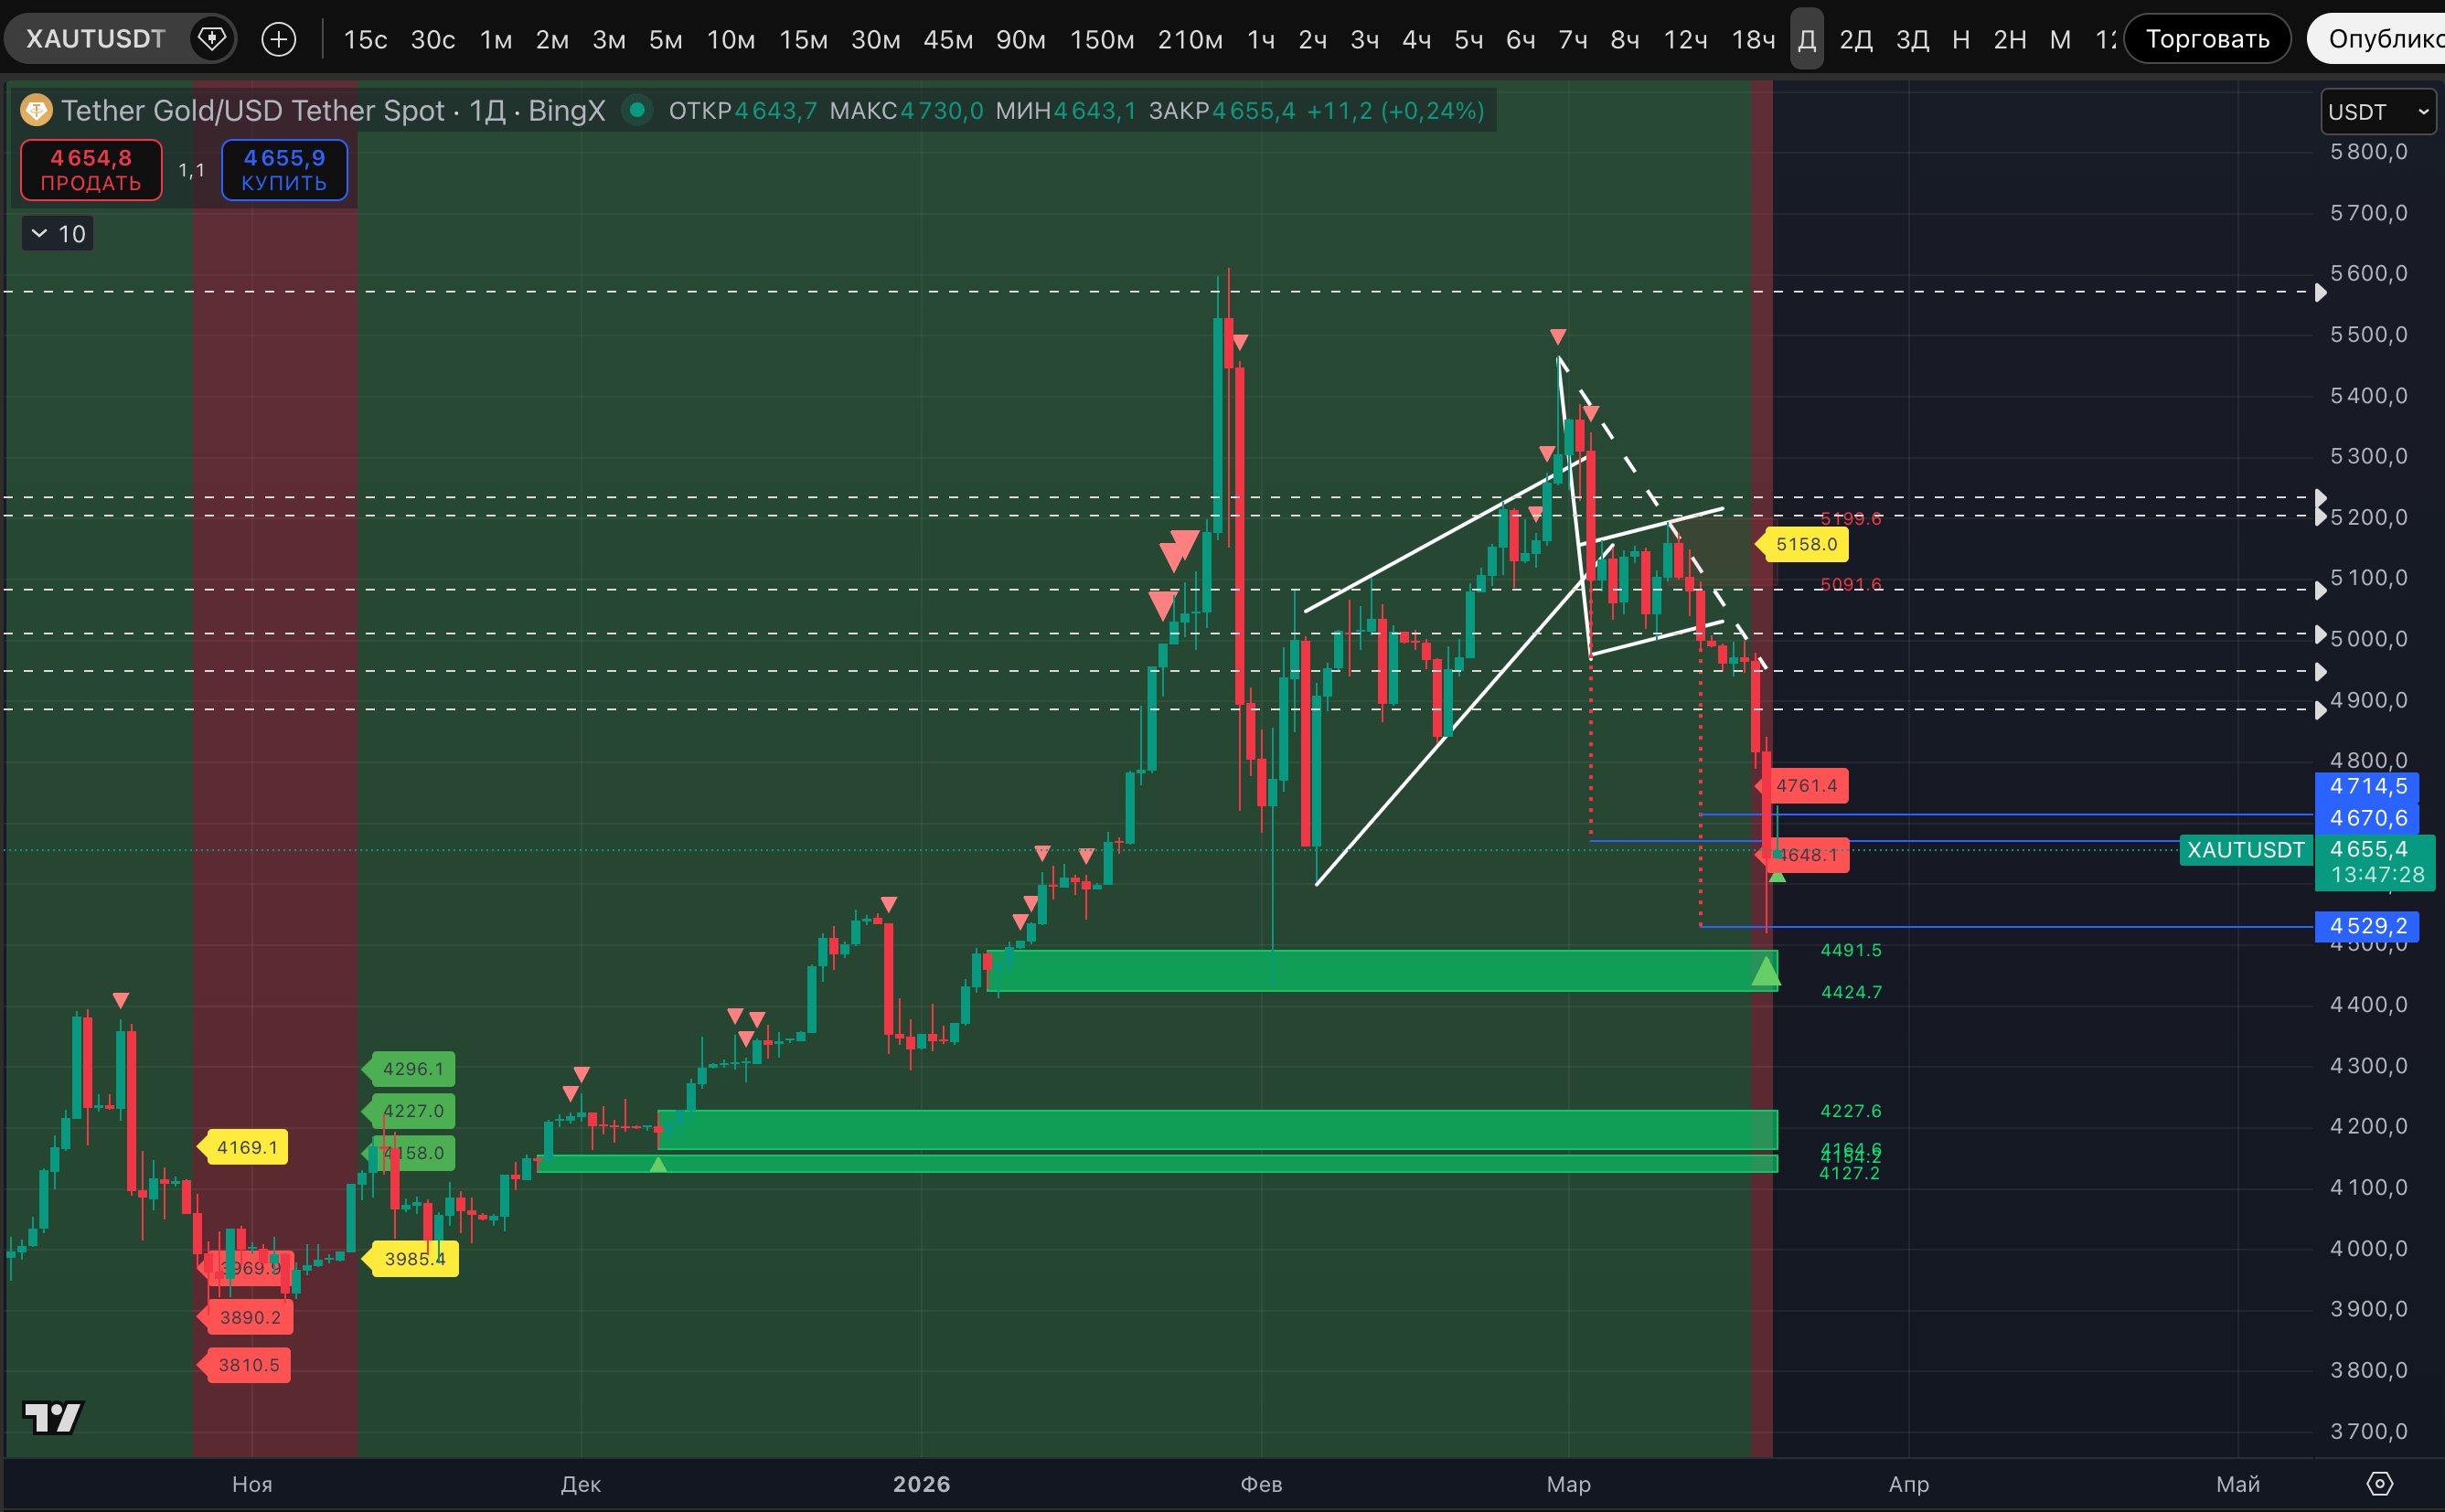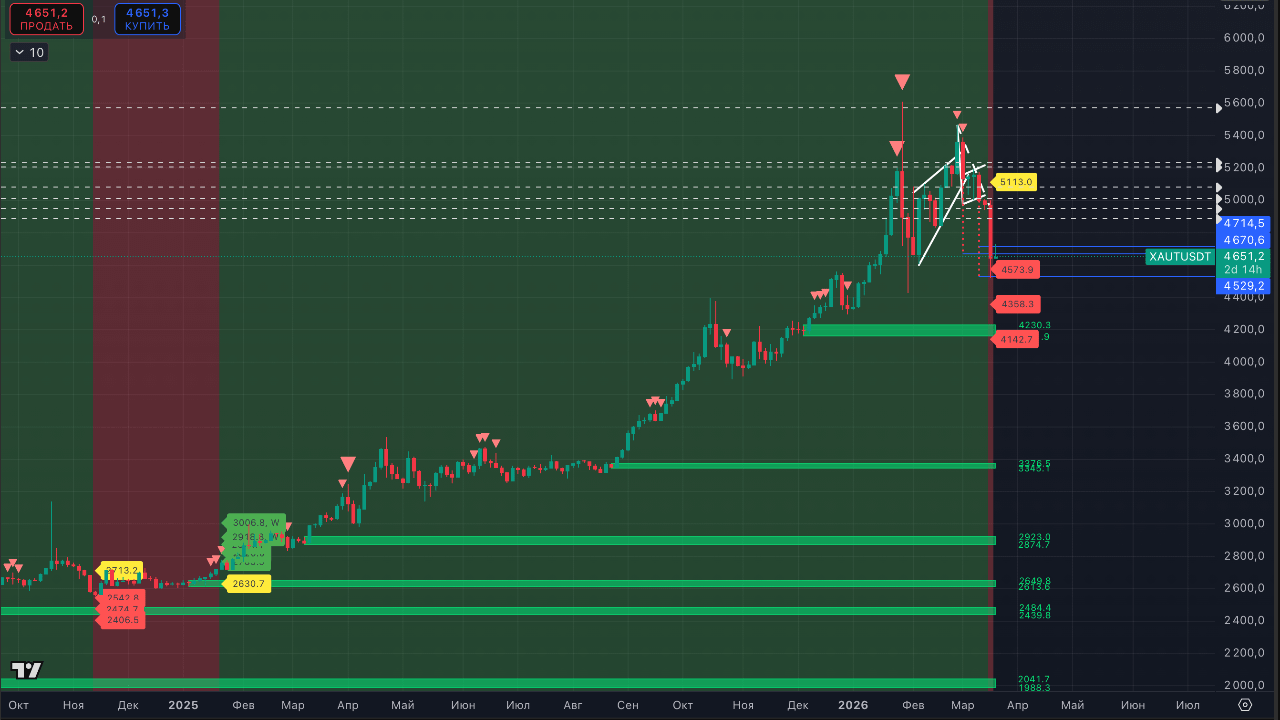

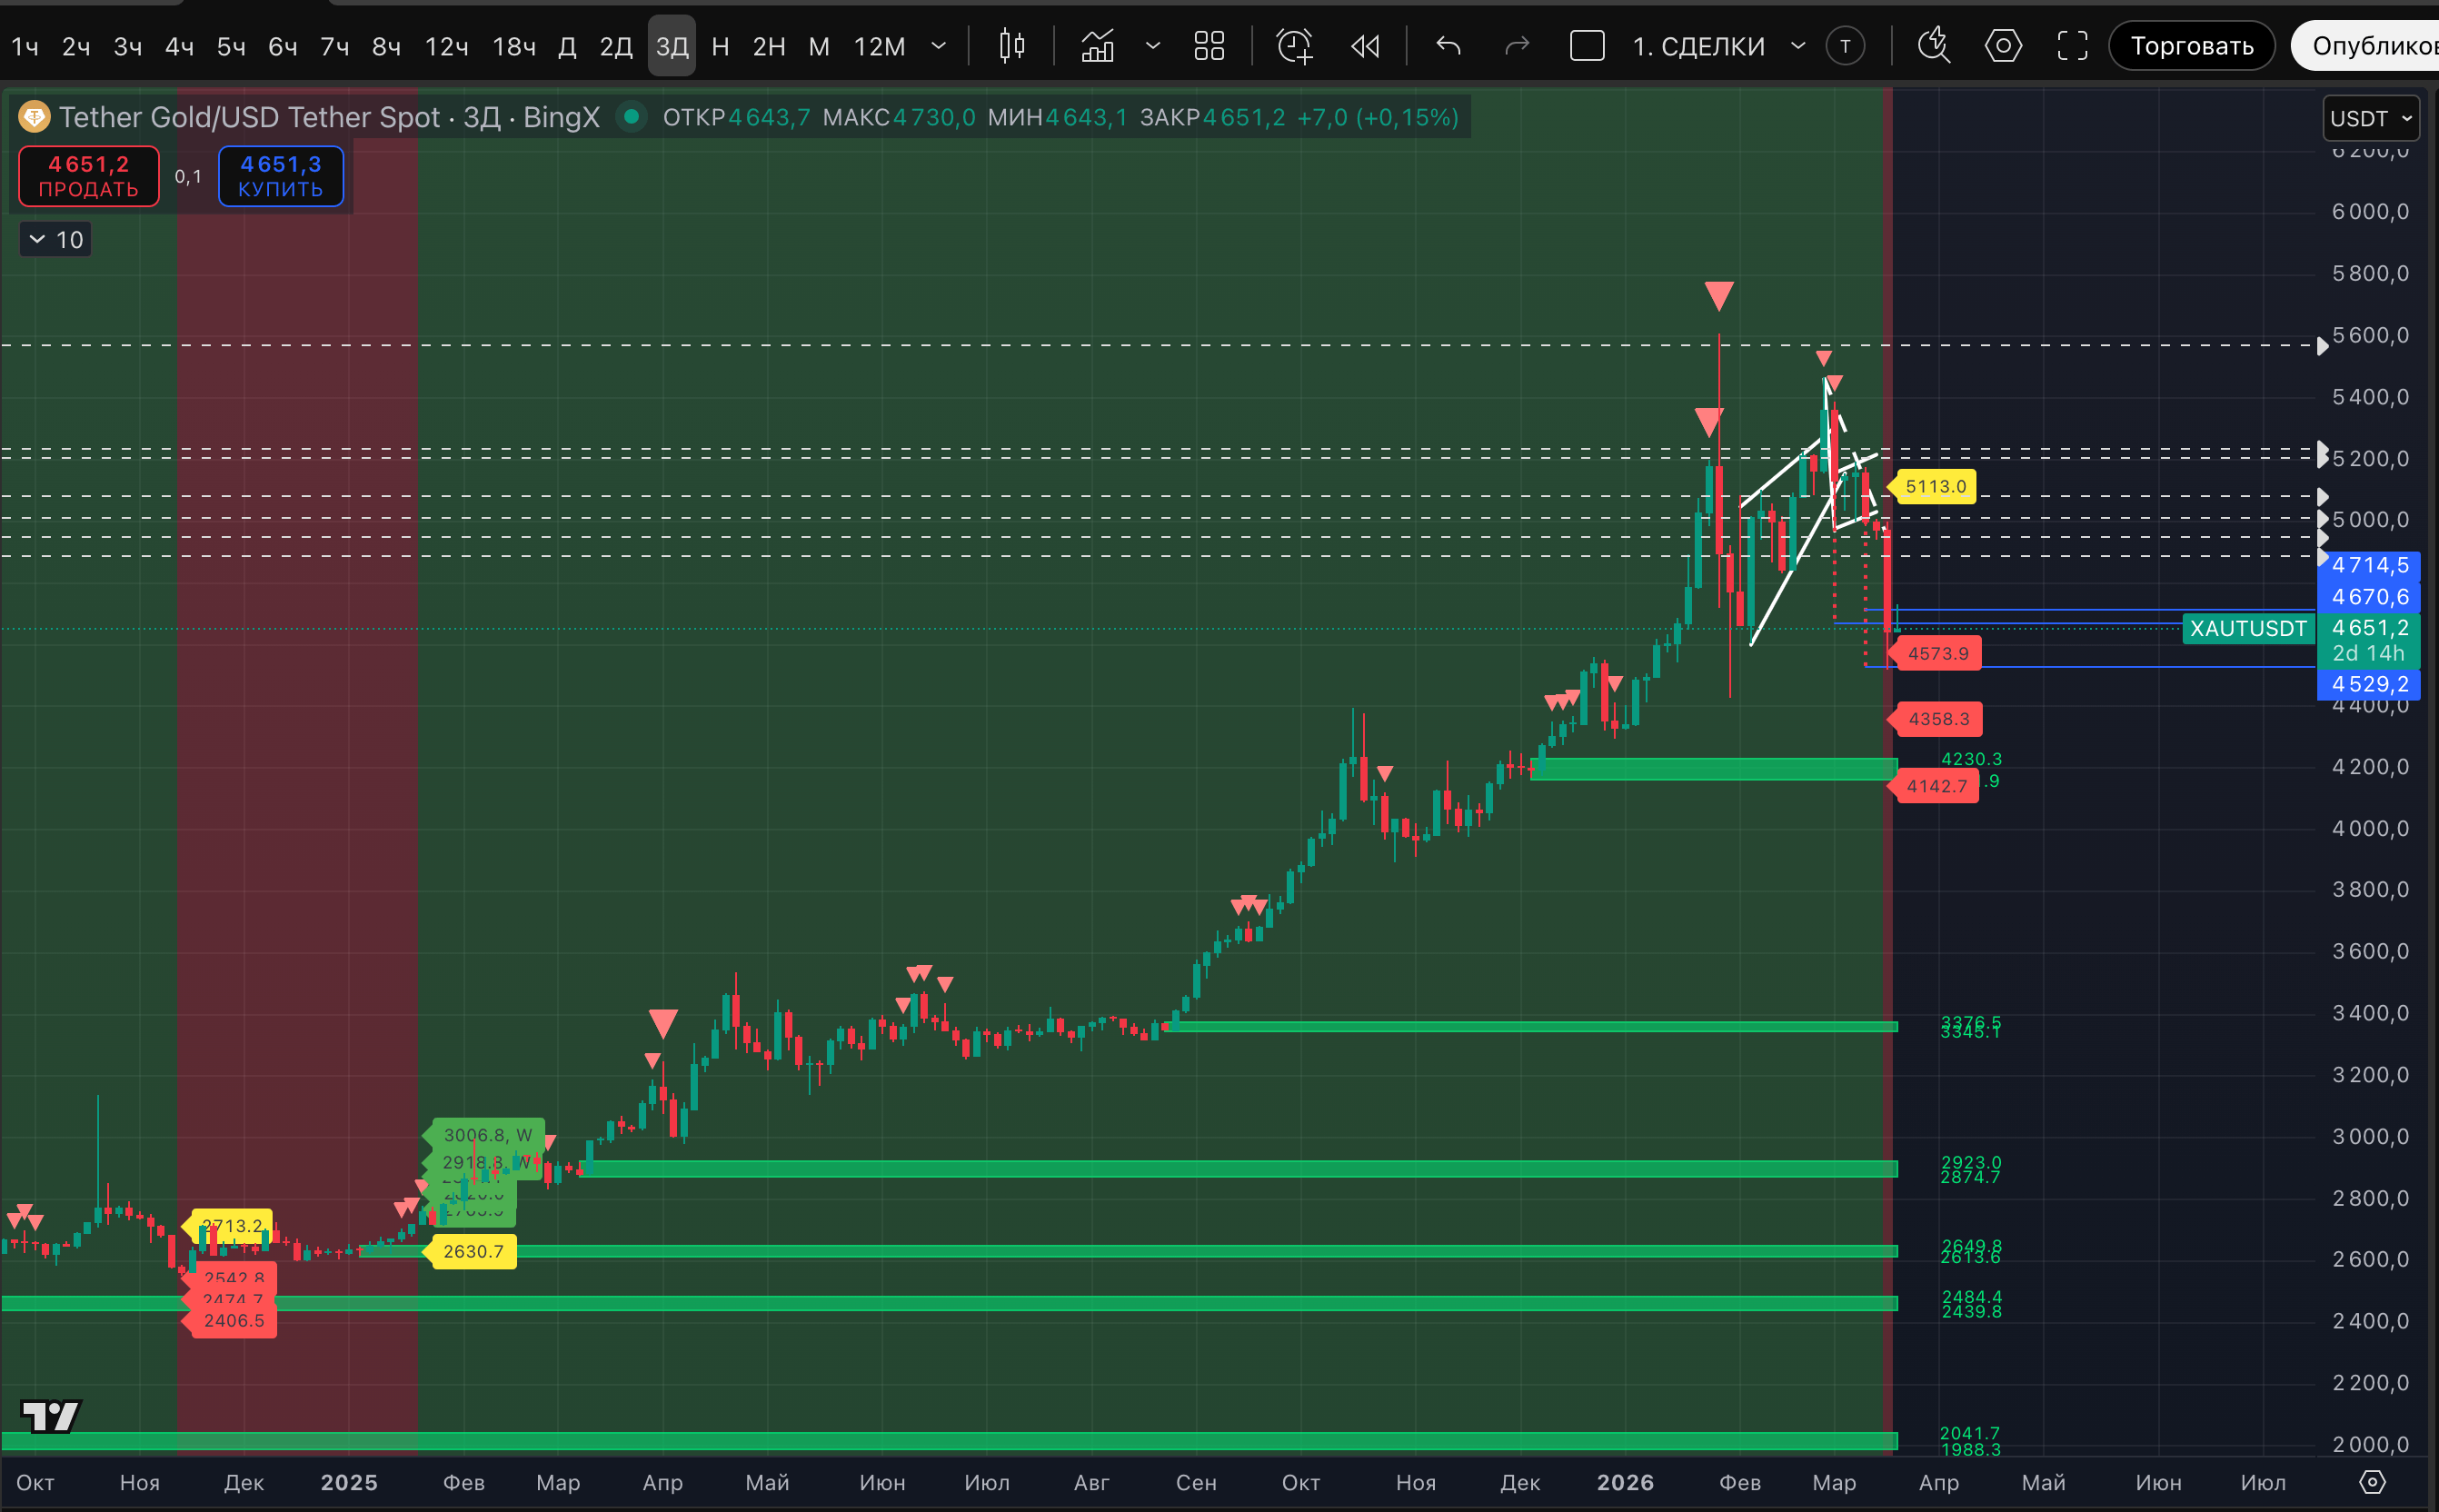
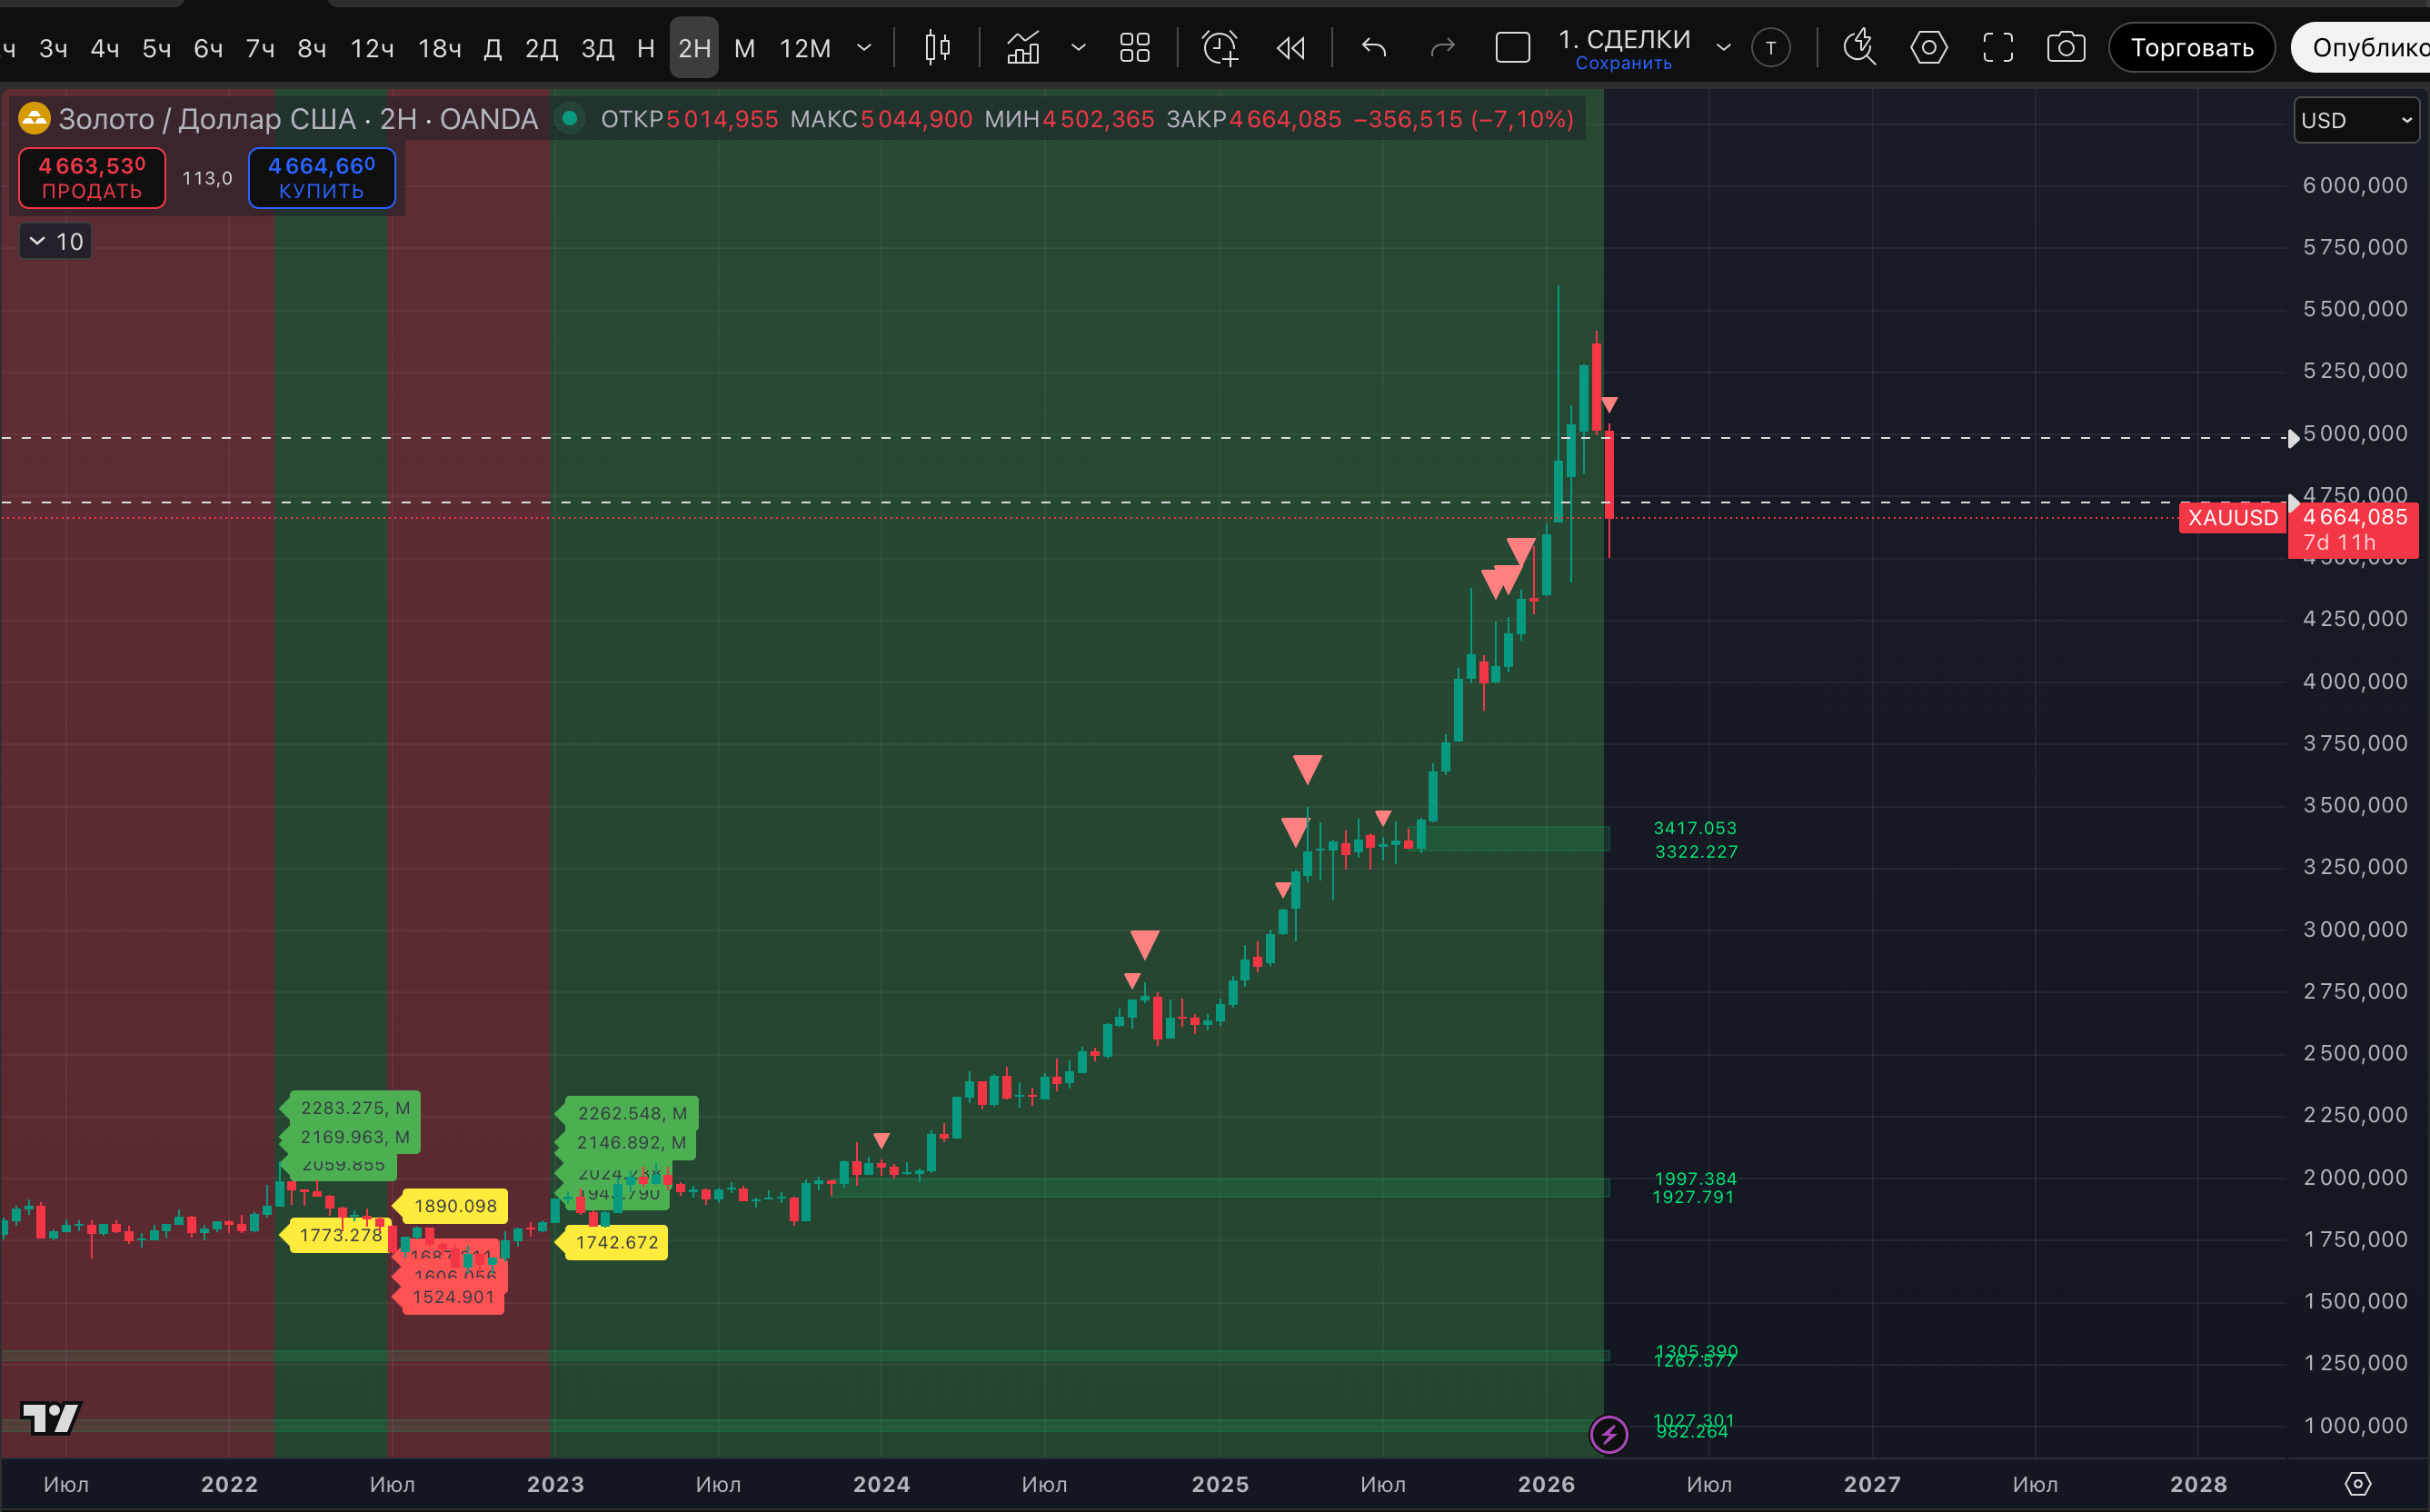
Gold confirms the forecast of a long-term correction - for the first time since January 2025, there is a downtrend on the 3-day timeframe. Basic targets: 4,573$, 4,358$, 4,142$. Potential breakdown level: 5,113$.
A fact that is very important for both the stock and cryptocurrency markets. If we assume that amid the deflation of a huge bubble, a rise in risky assets will begin on TOP-defensive assets. Although the modern world can surprise - we proceed from technical analysis and historical patterns. Because we have no access to insights on wars.
Let’s remember that the average duration of a bear market for BTC/gold is about 14 months, and they are coming to an end. Such data was provided in January of this year by #Bitwise.
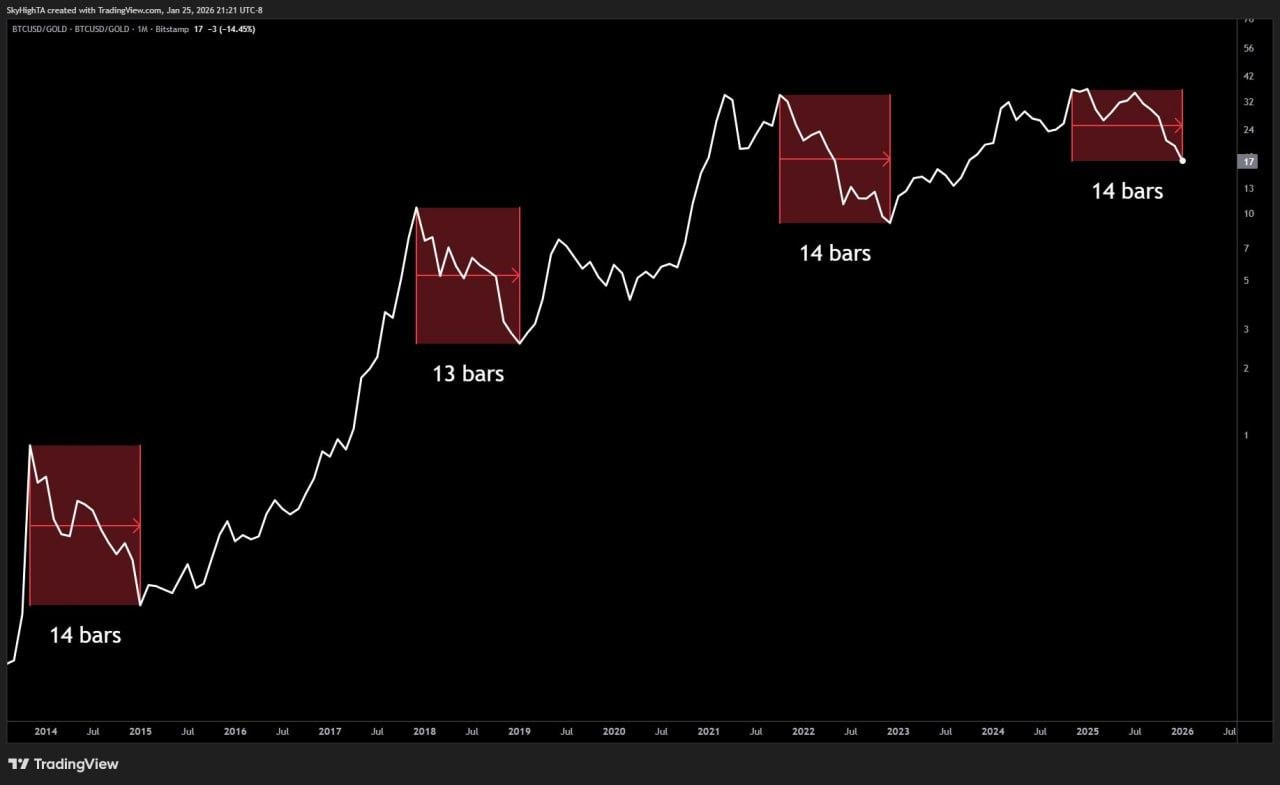
Statistics are statistics, and the bear market in the BTC/gold pair actually lasts on average 13-14 months. Already three times.
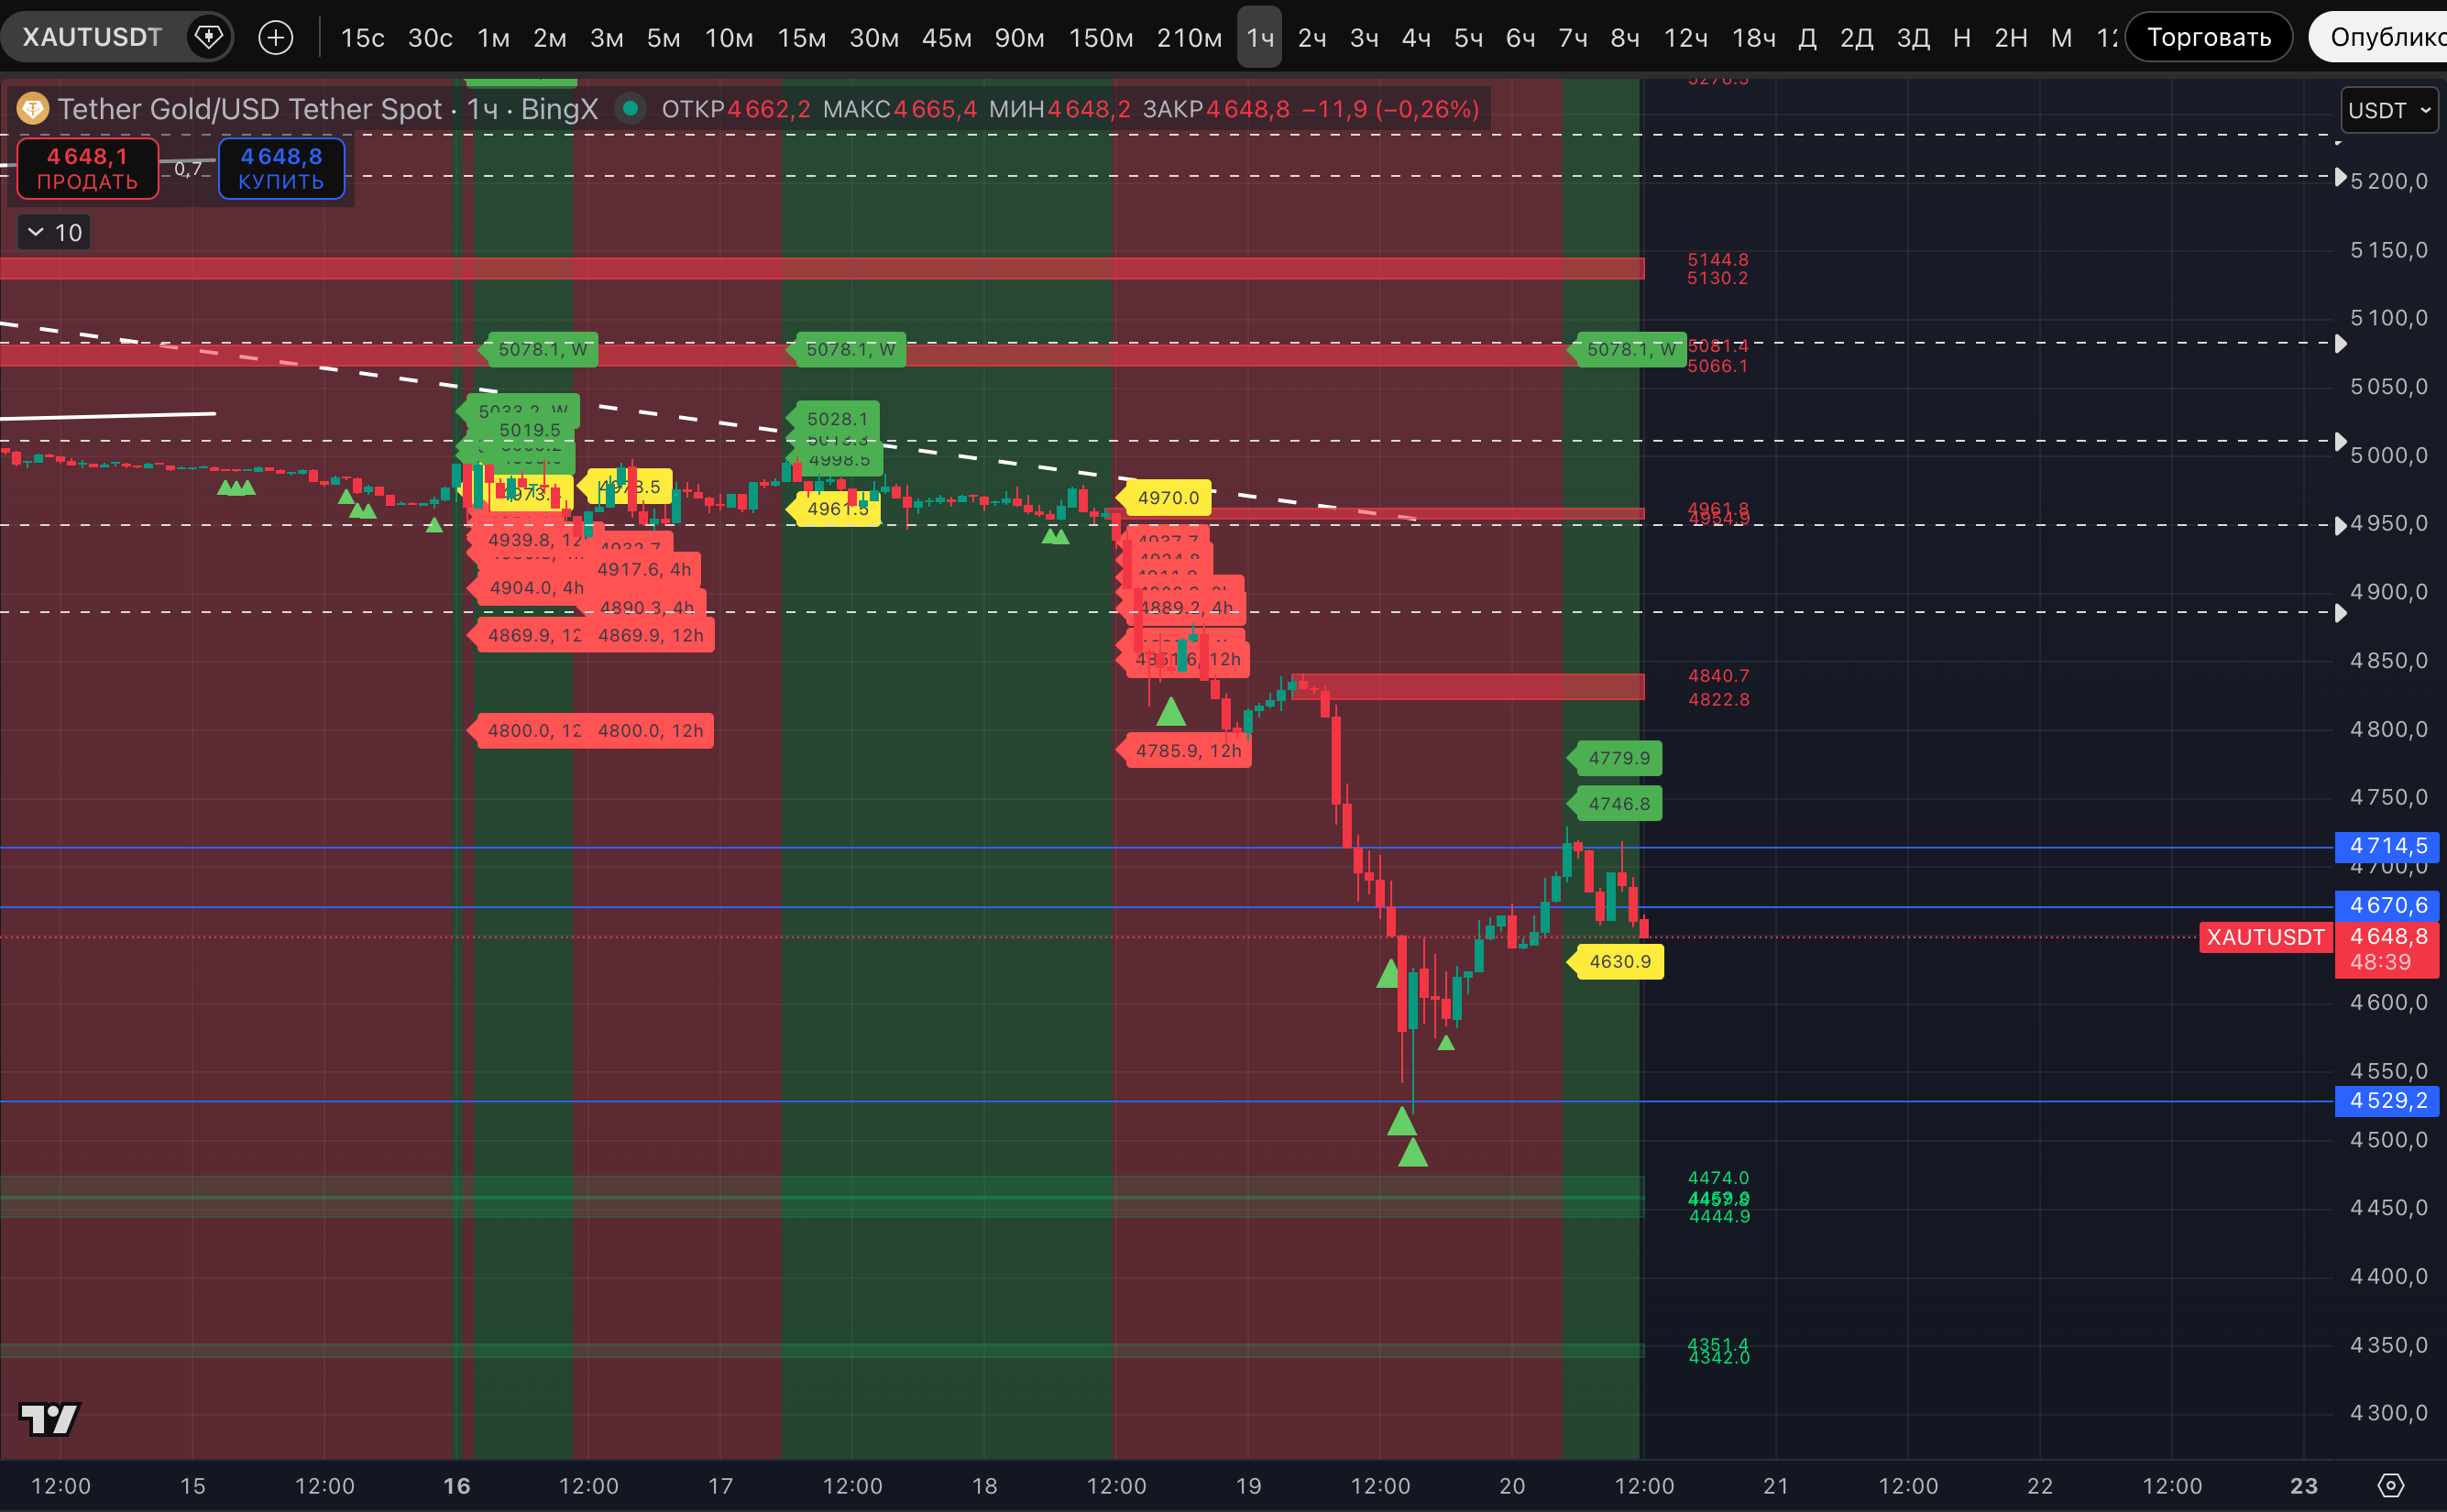
Specifically regarding gold, based on the technical picture, we expect a bounce and are loading up almost the entire deposit allocated for a long-term short on XAUT. Currently, let’s remember, the position with a 17 leverage was opened on March 6 from the level of 5 117$ due to a downtrend signal on the 12-hour TF. And so far for a small amount. Paper profit +157%. The nearest logical zone where we would like to accumulate a short with correction signals is the zone 4 822-4 840$. But for now, we placed an order closer to the next zone 4 954-4 961$. At 4 950$.
A decrease to the area of 3 345-3 376$ (varies in details on different higher TFs, this is a range from the 3-day TF) is currently assessed as the most bearish scenario in the current descent. But we will monitor the situation in the moment.
If we draw a trend line through the lows of 2004 and 2018, then support is currently below 1 600. And the Psychological market cycle suggests that in the "Phase of Deflation" the trend line is reached, after which the price goes even below the trend line, into "Despair."
The key question, of course, is how long the descent will last. In the local growth cycle since 2015, the bounce from February 2 to 28 can be considered the "Return to Normal" and a bull trap. BUT in the global cycle, which has been going on since 1982, this is very unlikely to be such a rapid movement. And rather, the price after reaching the area of 3 345-3 376$ may just go for a bounce to form the "Return to Normal" in this more global picture.
Therefore, if the price eventually reaches 3 345-3 376$ and shows significant signals like Strong signal of a potential low on the weekly TF - we will think about fixing to look at the growth and enter a new short at its high.
We considered and still consider the gold short a project for years. We fully detailed and justified all the logic in a series of posts.
Let’s recall the marks of the potential high that are currently on our indicator for gold on higher TFs:
- On the 2-week TF, the fourth, additional mark of a potential high appeared. Confirming the break of the uptrend.
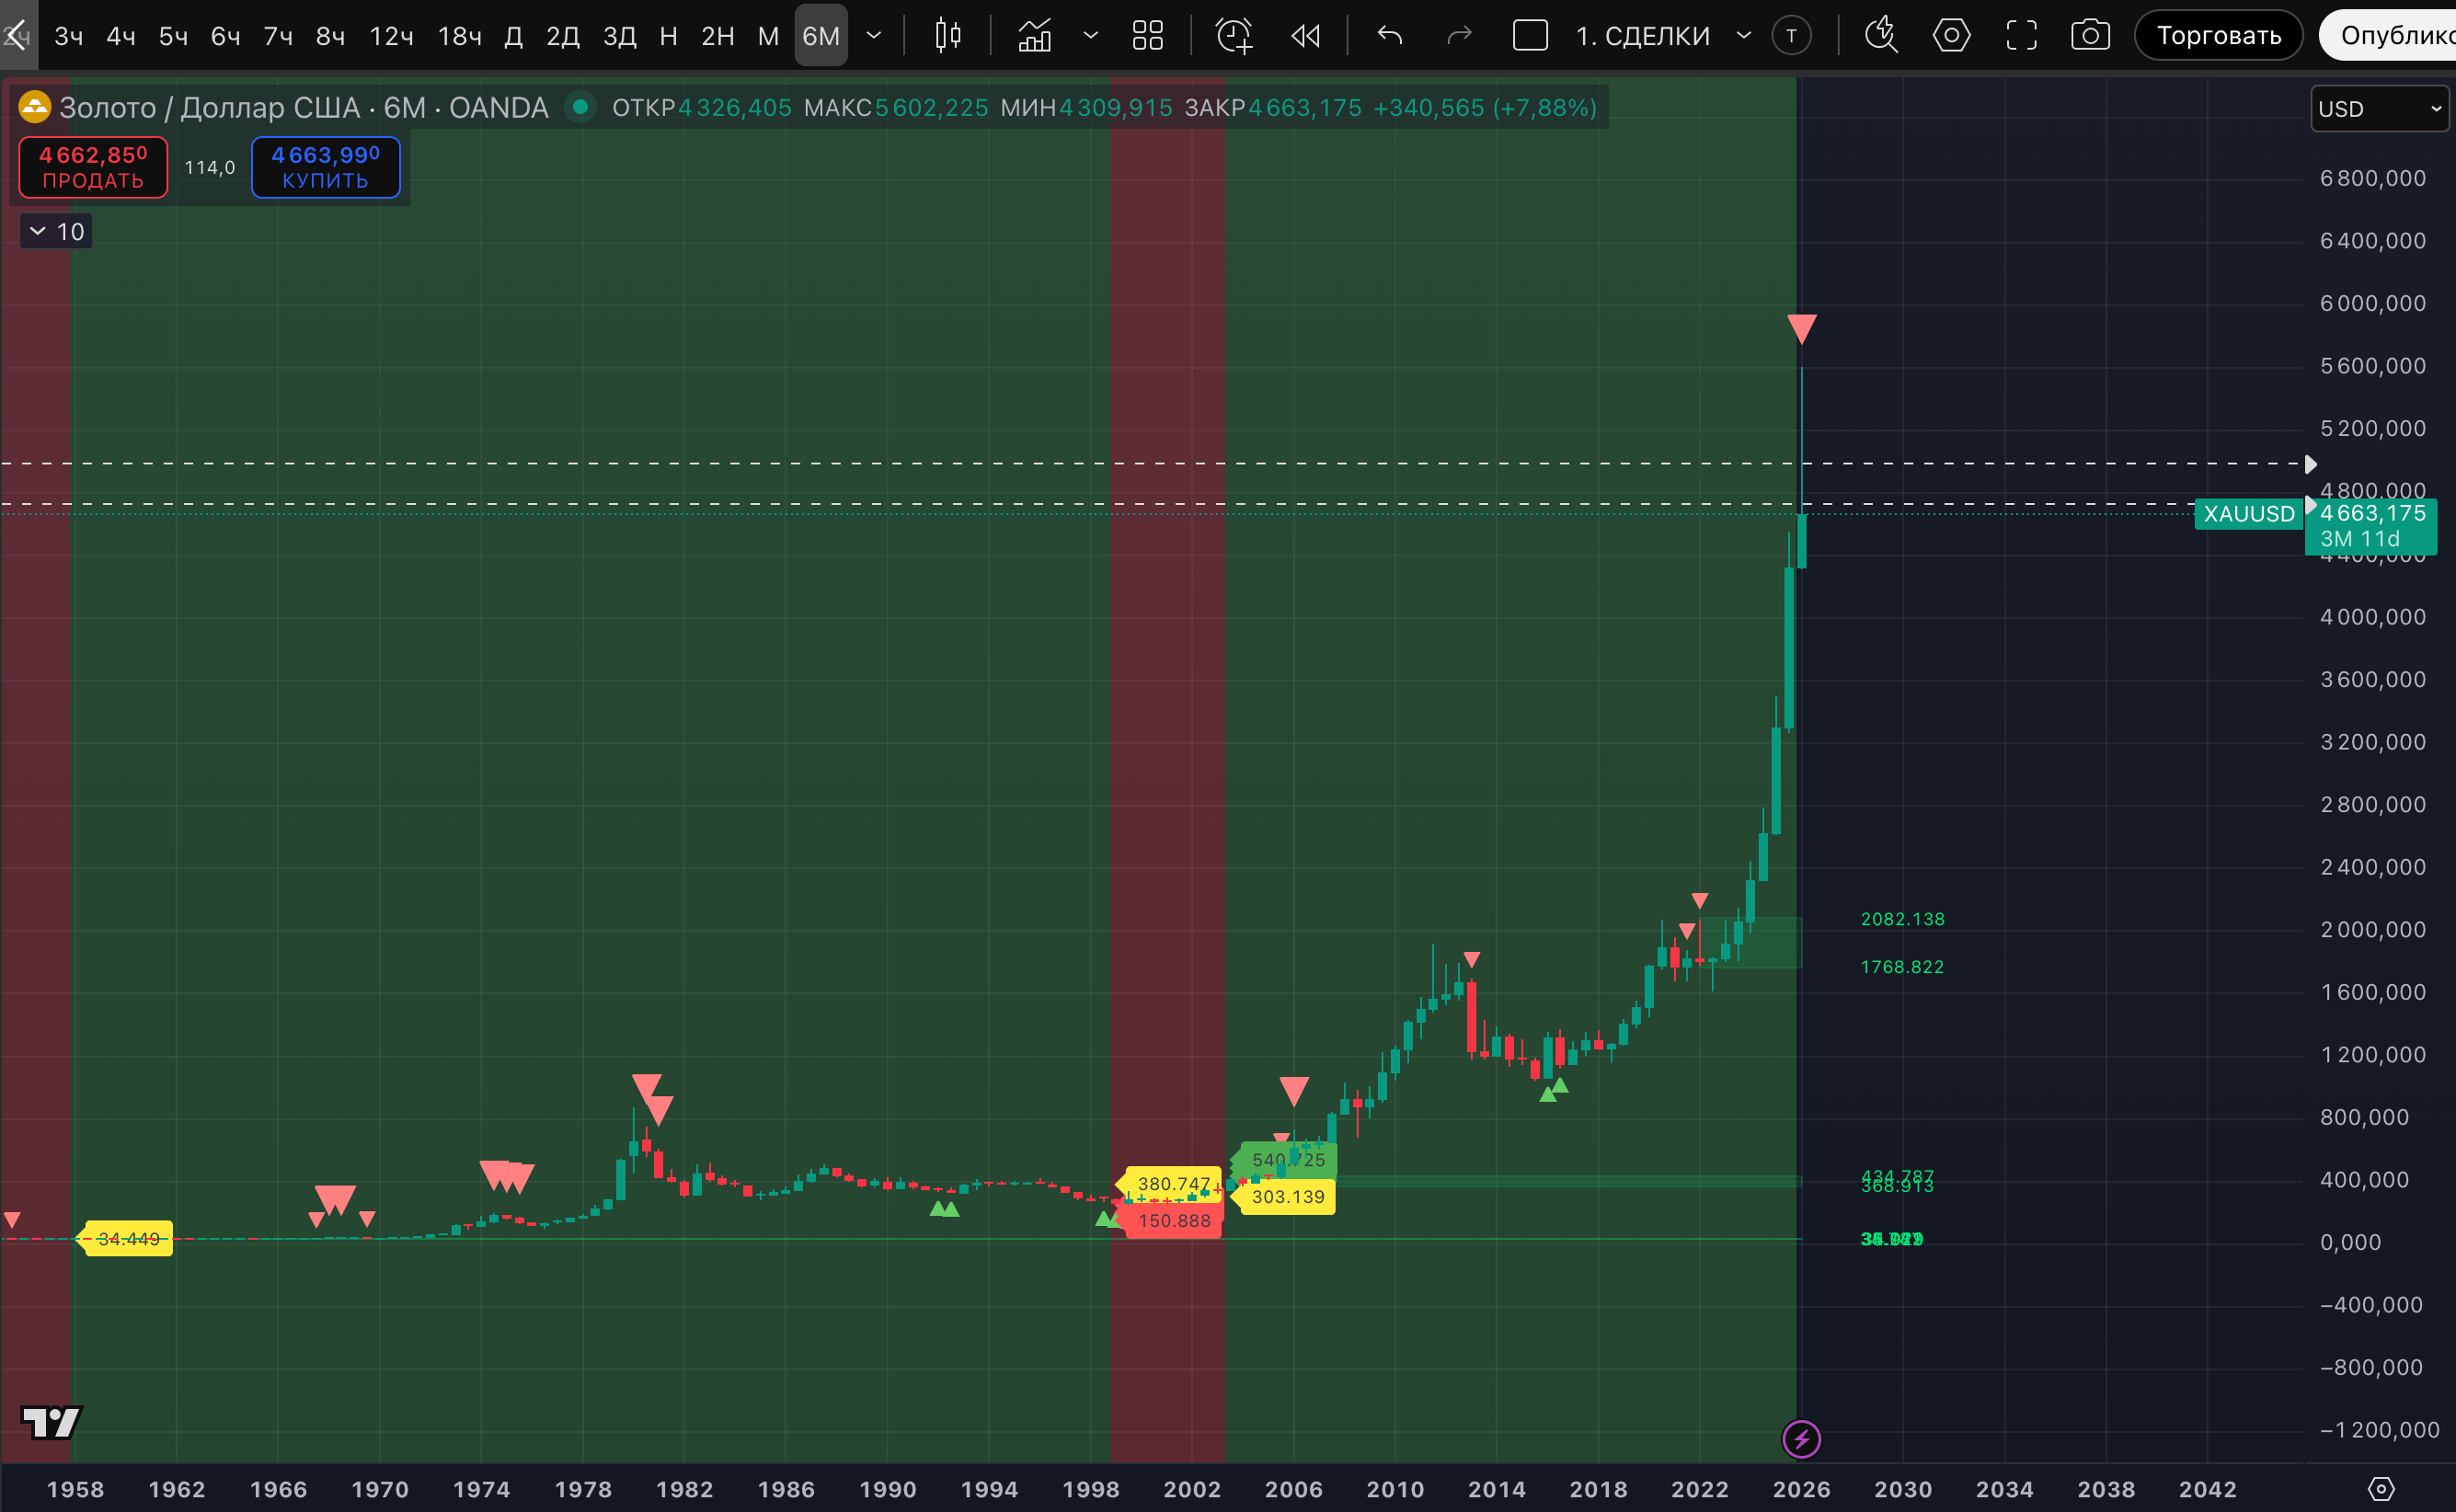
- On the 6-month TF, there is a Strong signal of a potential high, and while the candle looks bearish, there are still almost 3.5 months until its closure.
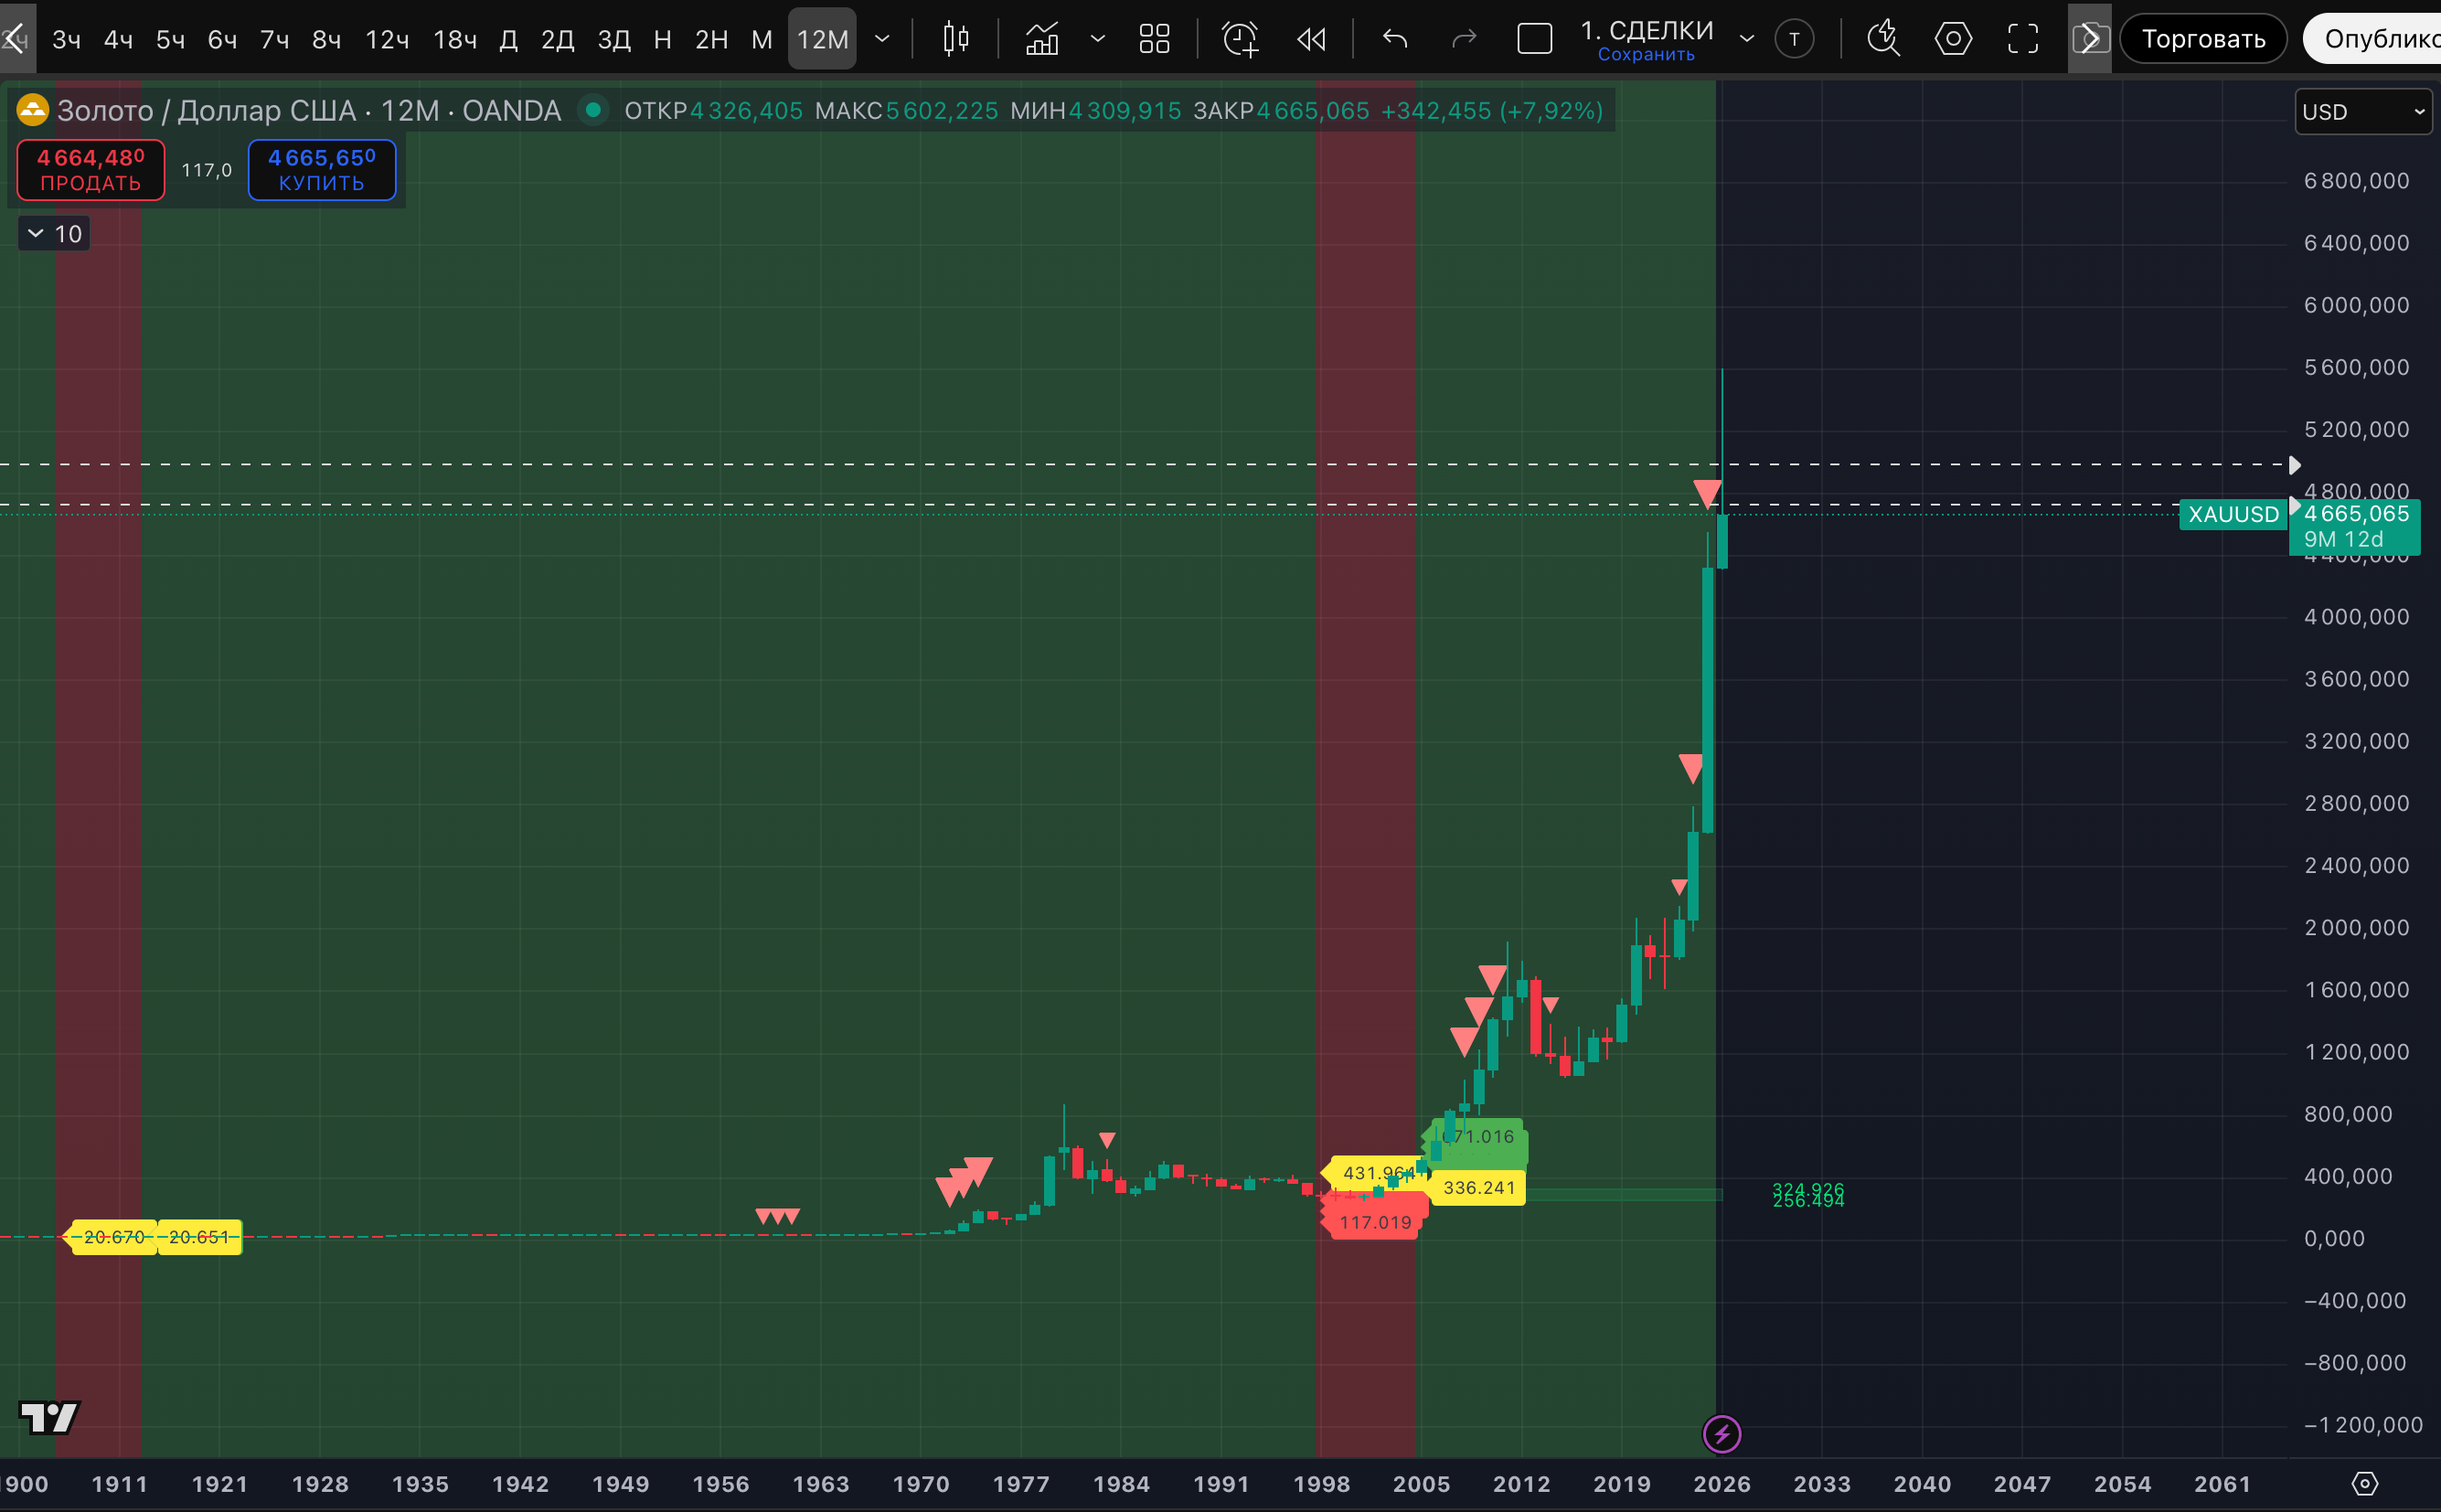
- On the annual TF, the year 2025 had the last third mark of a potential high, with two marks being Strong signal.
Well, for now, locally, on 6-, 7-, 8-hour, daily TF - loyalty marks allowing to wait for the continuation of the bounce. To add to the short.