


Dogecoin faces headwinds as altcoins decline across the cryptocurrency market on Tuesday.
DOGE is approaching a breakout of a rising wedge pattern, increasing the risk of a drop towards $0.2000.
Both MACD and RSI reinforce Dogecoin's bearish control.
Dogecoin (DOGE) faces a weak technical structure, trading below $0.2300 on Tuesday. The short-term bearish outlook for the meme coin reflects a shaky sentiment in the broader cryptocurrency market ahead of October.
With extreme volatility characterizing trading in September, investors feel uncertain about the future of the cryptocurrency market during the fourth quarter, despite optimism that the U.S. Securities and Exchange Commission (SEC) will approve several exchange-traded funds (ETFs) for alternative coins.
Retail demand for Dogecoin has declined
There has been a noticeable decline in retail interest since mid-September. According to data from CoinGlass in the derivatives markets, the average open interest (OI) for futures currently stands at $3.83 billion, having peaked at $6 billion on September 14.
OI refers to the nominal value of open futures contracts. Therefore, a steady decline in this metric means that traders are increasingly losing confidence in the meme coin's ability to maintain gains. This may also indicate that bets on DOGE's price increase are in free fall, increasing the chances of the downward trend continuing.
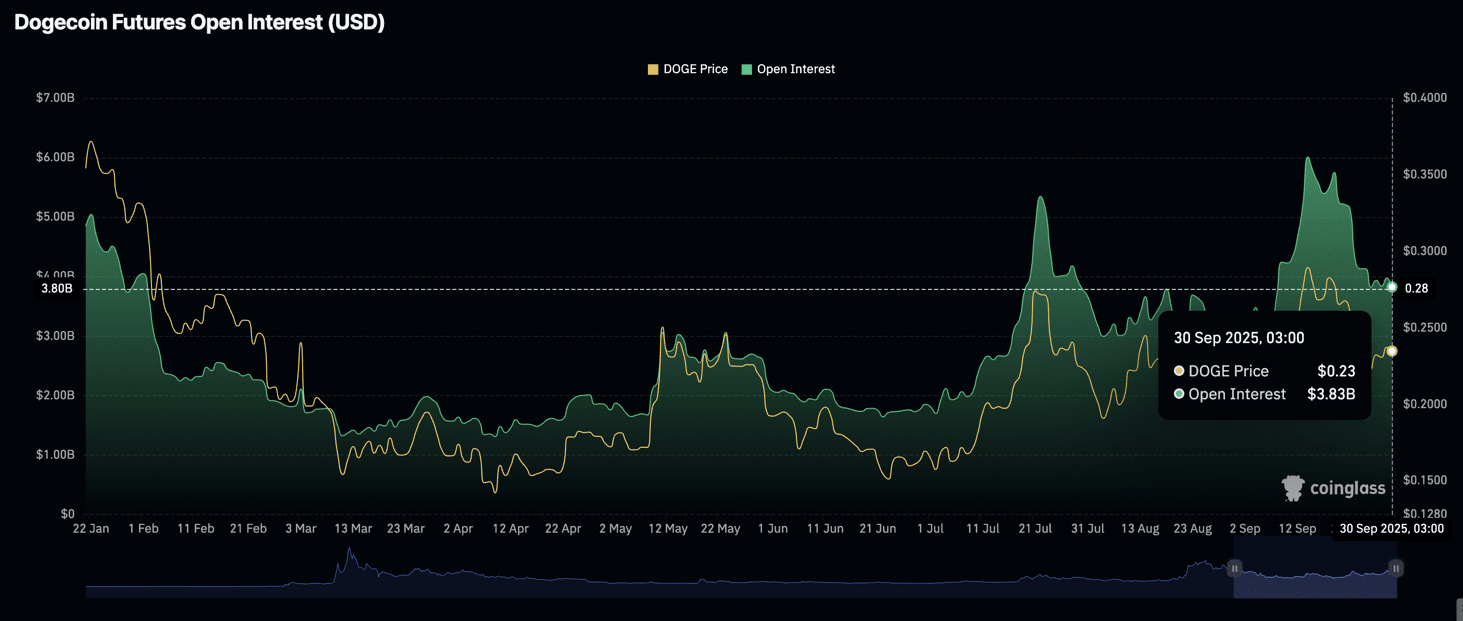
Open interest for Dogecoin futures | Source: CoinGlass
The weighted funding rate by OI for Dogecoin is trending downward towards the median line and may turn negative if bearish sentiment continues in the cryptocurrency market. As shown in the chart below, the average weighted funding rate by OI is 0.0017% at the time of writing this report on Tuesday, down from 0.0115% in mid-September. This indicates that more traders are moving towards short positions as the price of Dogecoin fluctuates.
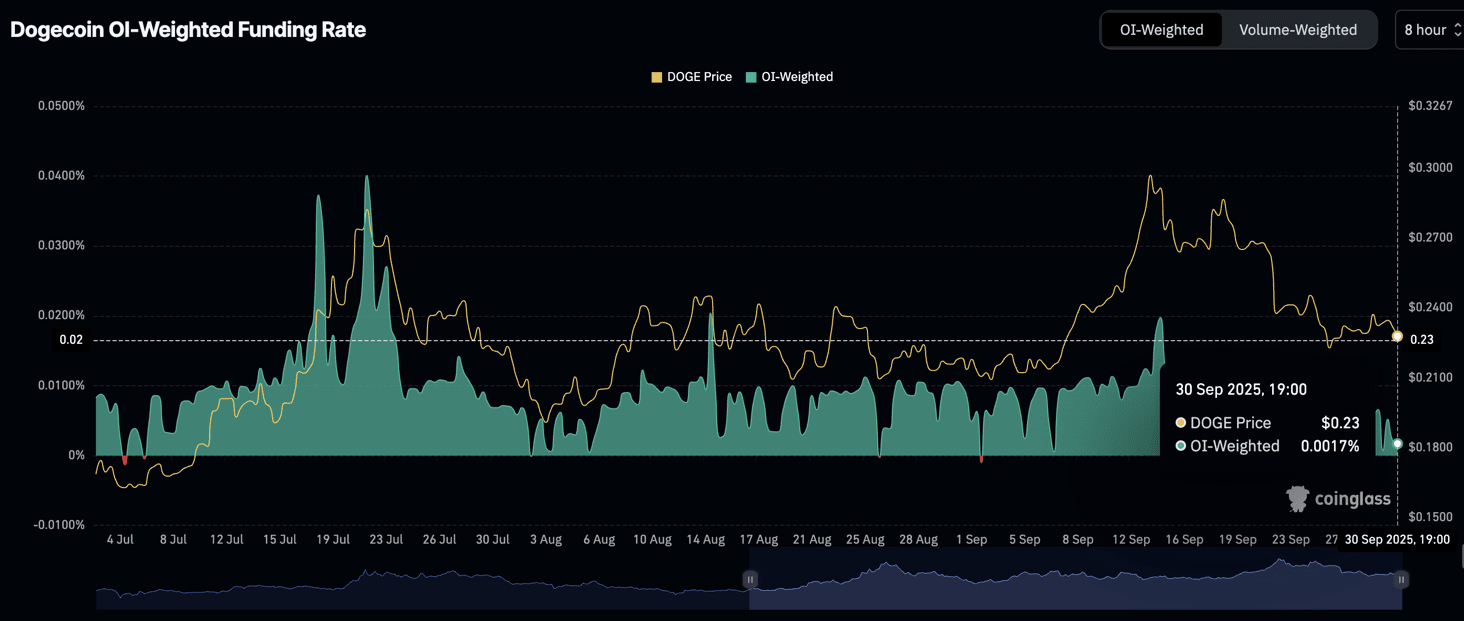
Weighted funding rate by OI for Dogecoin | Source: CoinGlass
Technical outlook: Dogecoin's downturn may extend as downside risks increase
The $DOGE is holding a narrow range between the support established by the 100-day exponential moving average at $0.2267 and the 50-day exponential moving average at $0.2371 on the daily chart. Bears are largely in control, supported by the Moving Average Convergence Divergence (MACD) indicator, which has maintained a sell signal since September 21.
A steady decline in the Relative Strength Index (RSI) indicates persistent bearish momentum. Investors will continue to reduce their risk exposure if the blue line remains below the red signal line.
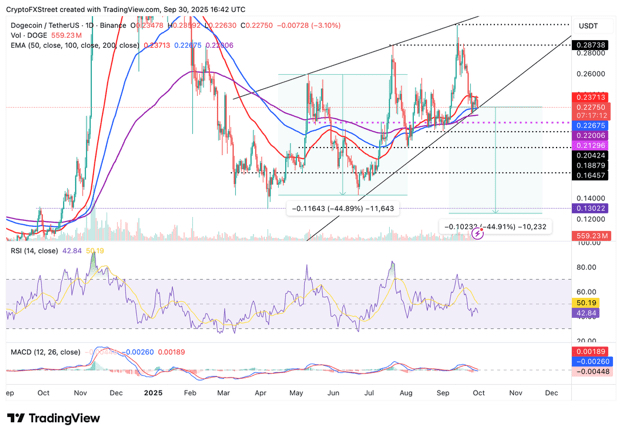
Daily chart for DOGE/USDT
The presence of a rising wedge pattern on the same daily chart may complicate the situation further for bulls. If $DOGE slips below the ascending trend line, which coincides with support from the 100-day exponential moving average, its decline may extend by 44% to $0.1255. This target is determined by measuring the distance between the widest points of the pattern and projecting it below the breakout point.
However, a short-term rebound cannot be ruled out if support from the 100-day exponential moving average at $0.2267 is maintained. A shift in sentiment in the broader cryptocurrency market as the fourth quarter approaches could boost risk appetite and support a recovery above $0.3000.
#Dogecoin #BinanceDoge #BinanceSquareFamily #BinanceSquare