

The price of Bitcoin is trading in the red zone on Friday, almost erasing its recovery from the beginning of the week.
Mixed flows of exchange-traded funds with a slight bearish tilt indicate caution amid increasing uncertainty surrounding ceasefire talks between the United States and Iran.
Reports indicate that Strategy remains the only corporate buyer of Bitcoin under current market conditions, as other major companies have failed to sustain demand.
Bitcoin ($BTC ) fell below $69000 as of the time of writing this report on Friday, nearly erasing its recovery from the beginning of this week. Increasing uncertainty around the ceasefire plan between the U.S. and Iran and the slight bearish lean among institutional investors caused the king of cryptocurrencies to fade, indicating trader caution and a lack of clear direction for the largest cryptocurrency by market cap.
Deal or no deal, Bitcoin may experience volatility.
Bitcoin started the week on a positive note, recovering about 5% on Monday after losses the previous week due to macroeconomic headwinds.
Monday's rebound came after U.S. President Donald Trump directed the Department of Defense to suspend attacks on power stations and energy infrastructure in Iran for five days, citing productive talks between the two countries.
These developments amid the ongoing war in the Middle East have bolstered risk appetite, as U.S. stocks and other risk assets like Bitcoin closed higher on Monday.
As the week progresses, uncertainty around ceasefire talks remains high. Early Thursday, Trump reiterated that Iran is engaged in negotiations to end the conflict.
Trump said: "They are negotiating, by the way, and they want to strike a deal badly. But they are afraid to say that, because they think they will be killed by their own people."
While Iranian Foreign Minister Abbas Araqchi stated on state television that his government did not participate in talks to end the war, indicating that "we have no intention for any negotiations."
These mixed signals from both sides continued to cloud the atmosphere, as the U.S. stock index wiped out its Monday recovery while Bitcoin also declined.
Later this week, Trump stated that Washington would halt attacks on the Iranian energy sector for 10 days, until April 6, at Tehran's request. However, Iran denied making such a request, highlighting the fragility of diplomacy and the low likelihood of a ceasefire in the near term.
Traders should exercise caution as negotiations about a ceasefire deal remain highly uncertain, with recent news suggesting a slight negative outcome that could bring new volatility to risk assets. Bitcoin continues to trade in the red as of the time of writing this report on Friday, below $69000.
Institutional demand leans slightly downward.
Institutional flows reflect mixed market sentiment, with a slight bearish lean so far this week. Data from SoSoValue shows that Bitcoin ETFs experienced mixed flows this week, starting with positive inflows of $167.23 million on Monday, followed by outflows of $74.53 million on Tuesday, light inflows of $7.81 million on Wednesday, and negative outflows of $171.22 million on Thursday.
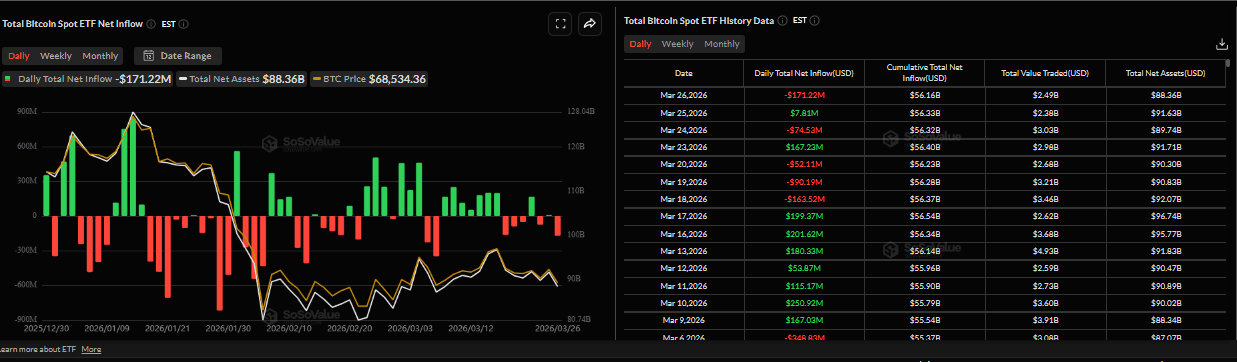
Daily net flow chart for instant Bitcoin funds. Source: SoSoValue
As of Thursday, net flows show a slight bearish trend, with total net outflows of $70.71 million this week. If these outflows continue on Friday, the week will end on a negative note, breaking a four-week streak of positive flows, which could lead to further correction towards the king of digital currencies.
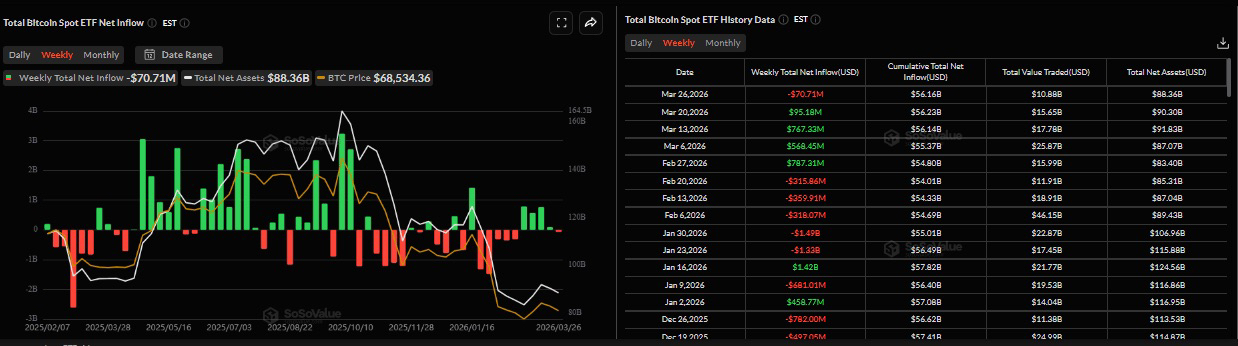
Weekly net flow chart for instant Bitcoin funds. Source: SoSoValue
On the institutional side, Michael Saylor announced on platform X on Monday that Strategy (MSTR) purchased another 1031 Bitcoins worth $76.6 million after acquiring 22337 Bitcoins the previous week. The company's total holdings after Monday's purchase reached 762099 Bitcoins, highlighting its ongoing aggressive accumulation strategy despite the uncertainty in global markets. The average purchase price for Strategy across all its holdings is $75694, which is above the current market price.
Strategy is the only buyer of Bitcoin under current conditions.
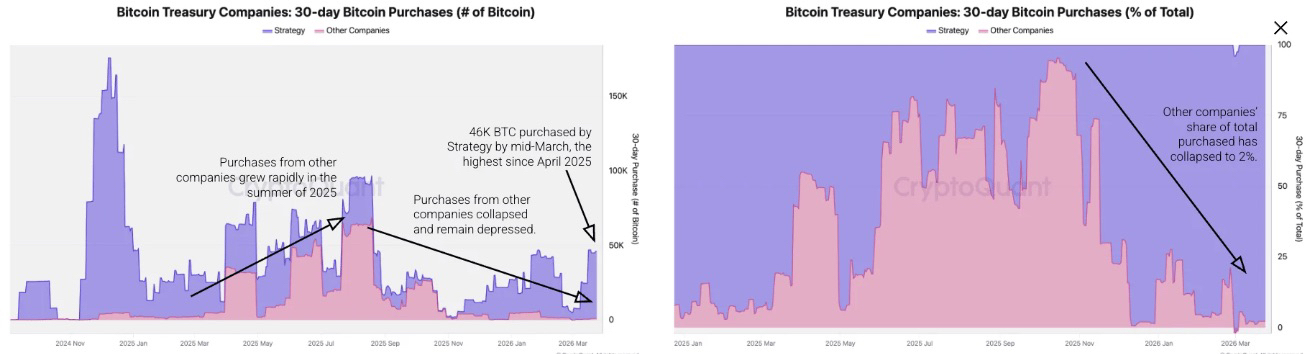
Looking deeper into Strategy's recent purchases, the CryptoQuant weekly report highlighted that MSTR is the sole driver of Bitcoin treasury demand.
The report clarified that Strategy has accumulated more than 45000 Bitcoins over the past thirty days, marking the highest purchase over 30 days since April 2025. In contrast, Bitcoin purchases from all other treasury companies collapsed, totaling only 1000 Bitcoins over the past thirty days, down 99% from the peak of 69000 Bitcoins in August 2025. Furthermore, the share of purchases from these other companies dropped to 2%, compared to 95% last October.
The report noted that "As a result of these dynamics, Strategy's holdings reached new record levels, while the holdings of other companies stalled."
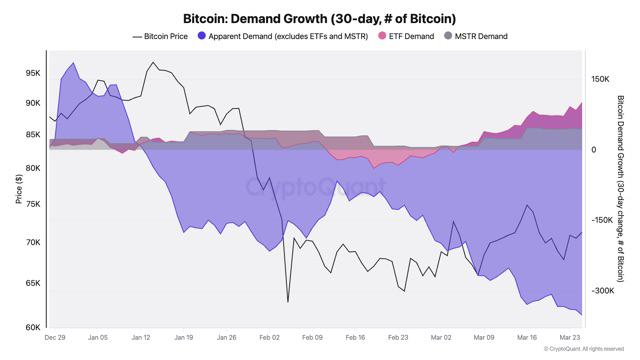
In an exclusive interview, Julio Moreno, head of research at CryptoQuant, told FXStreet: "I don't think Strategy alone can support the price of Bitcoin for long. To support the price of Bitcoin, overall demand must grow, and that is not the case today," when asked about Strategy's current aggressive accumulation.
Additionally, Moreno shared his analysis in the chart below: "Currently, Bitcoin demand has shrunk except for ETFs and Strategy by 452,000 Bitcoins over the past thirty days, as shown in the purple area of the chart."
Expiration of options worth $13 billion.
According to Deribit data, options $BTC worth $12.88 billion will expire on Friday. The chart below shows that the "maximum pain price" is currently around $74000, which is higher than the current trading level near $69000. As expiration approaches, markets tend to gravitate toward the level where most options expire worthless (at $74000), indicating that the price of Bitcoin may rise to this level. However, traders should be cautious as current conditions suggest that this rise may not materialize fully, leaving room for continued downward pressure.
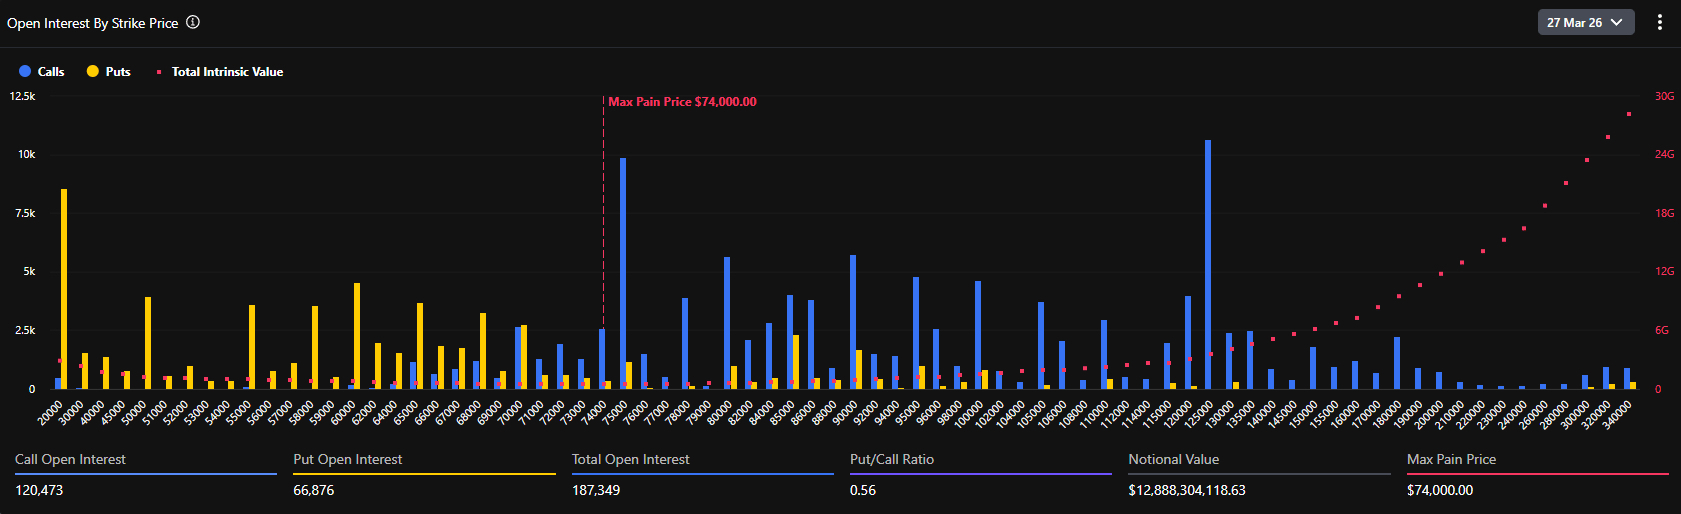
Open interest in Bitcoin by strike price for March 27. Source: Derbit
Technical forecasts indicate a cautious tone.
As shown in the weekly chart below, the largest cryptocurrency by market cap faced rejection around the annual low of 2025 at $74508 last week and found support around the 200-week exponential moving average at $68072. At the time of writing this report on Friday, the price of Bitcoin hovers near this dynamic support level.
If the 200-week exponential moving average at $60072 fails to hold as support, Bitcoin's correction may extend toward a Fibonacci retracement level of 78.60% at $65520 (drawn from the August 2024 low of $49000 to the all-time high of October 2025 at $126199).
The relative strength index (RSI) reads 34 on the weekly chart, below the neutral level of 50 and close to the oversold territory, indicating that the downward momentum continues but has not yet exhausted. The moving average convergence divergence (MACD) indicator on the same chart also showed a bearish crossover in mid-August, which remains in place, supporting the negative outlook. However, the shrinking red histogram bars, with the MACD line approaching the signal line, indicate a easing of selling pressure.
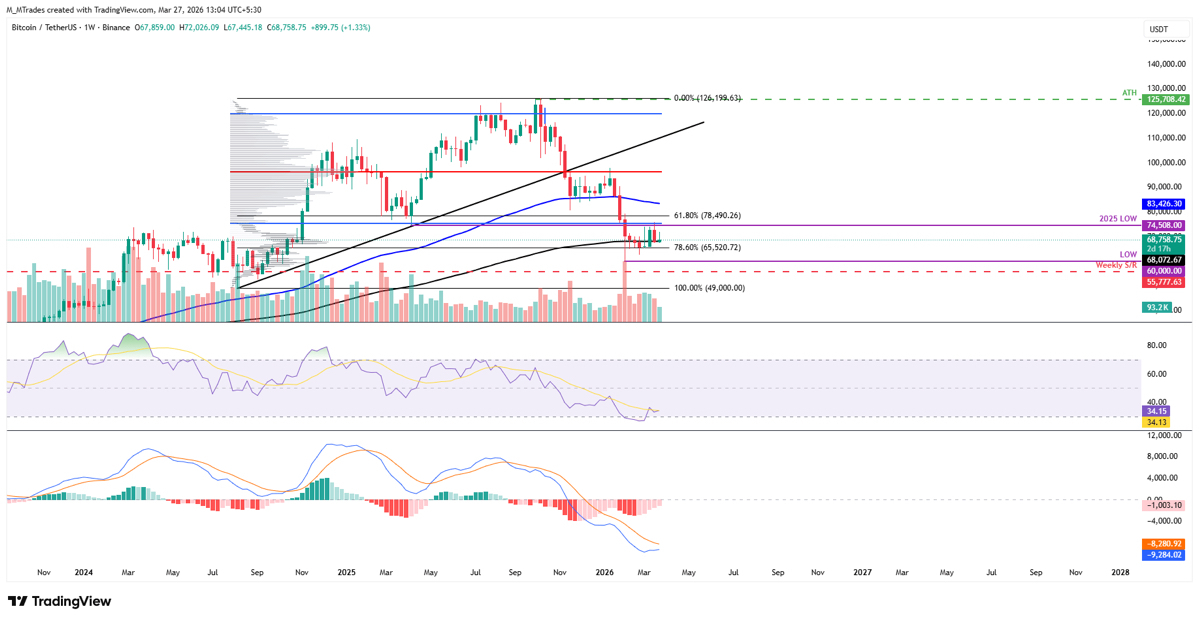
Weekly chart for the Bitcoin/Tether BTC/USDT pair.
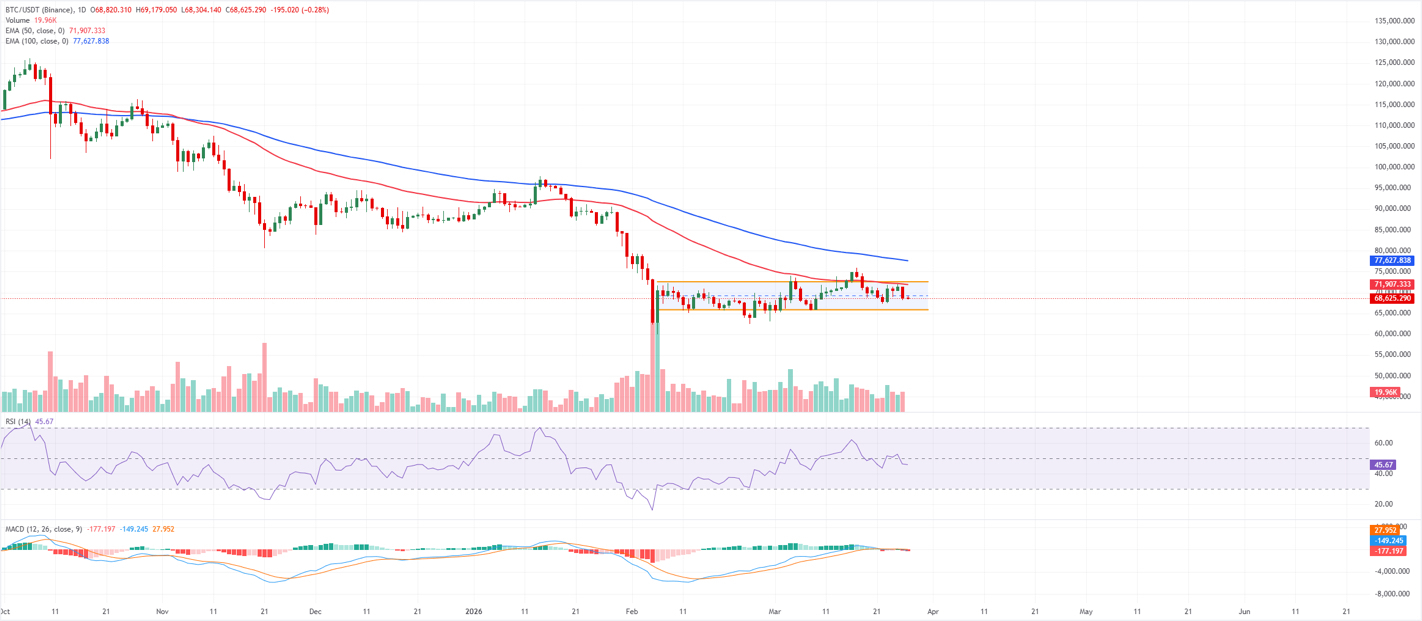
On the daily chart, the short-term trend is cautiously leaning down for the king of cryptocurrencies, as the price trades below the midpoint of the horizontal channel at $69000. The $BTC also remains below the 50-day and 100-day exponential moving averages, which are clustered between $71900 and $77600 respectively, continuing to curb the broader rally and framing the current progress as a corrective bounce within a broader downtrend.
Momentum leans slightly downward, with the RSI hovering in the mid-forties on the daily chart, reflecting limited buying pressure, while the MACD histogram has turned mildly negative, indicating early signs of bearish momentum.
First resistance shows at the channel top around $72500, supported by the declining 50-day exponential moving average near $71900; a daily close above this area will be essential to weaken the bearish structure and open the way toward the 100-day exponential moving average near $77600.
On the downside, immediate support is at Monday's low around $67500, followed by the channel base and the previous low near $65900, where buyers previously stepped in. A break below $65900 would confirm the start of a new bearish wave toward $60000, a key psychological level.
#BinanceSquare #BinanceSquareFamily #BinanceSquareBTC #BTC走势分析 #BTC☀