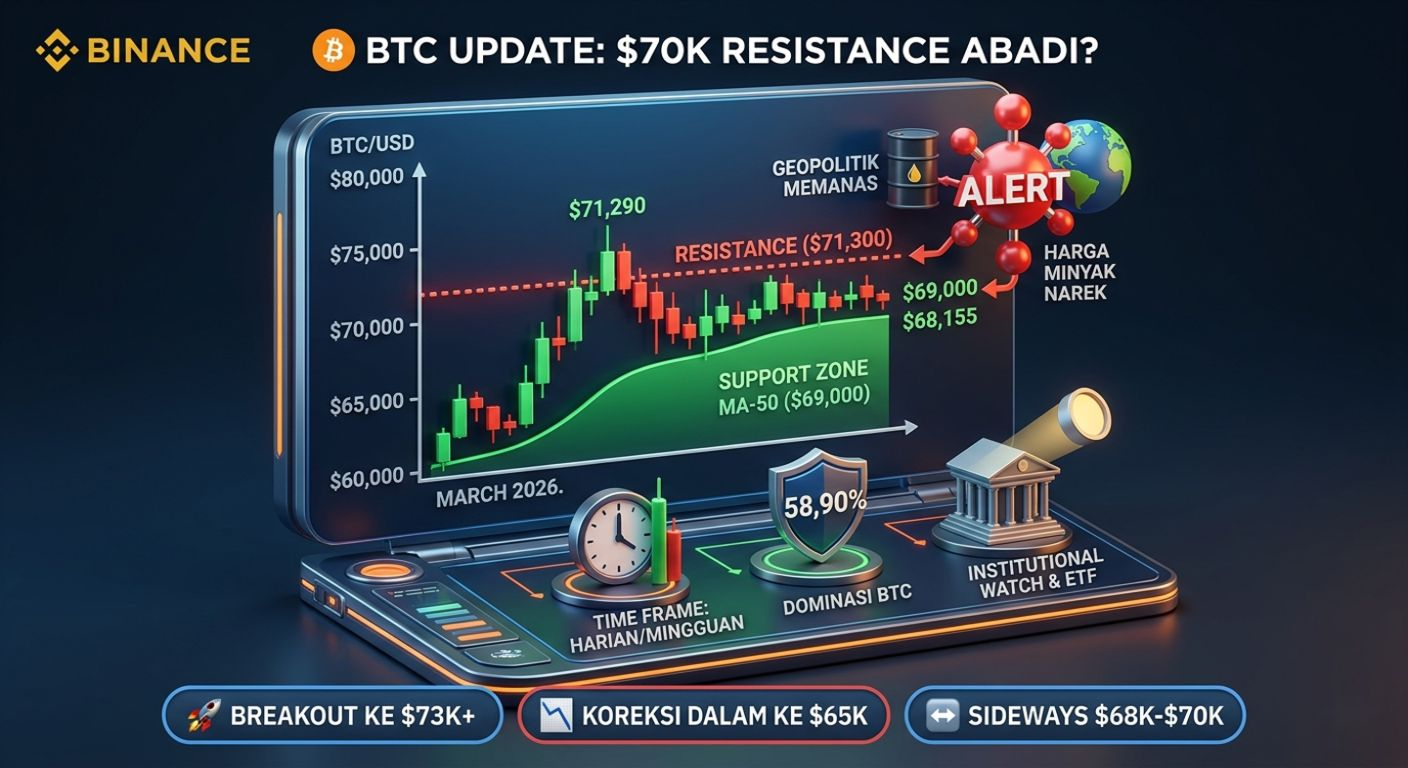
Bitcoin $BTC is once again showing high volatility at the close of March. After briefly touching the highest level at $71,290, BTC experienced a sharp correction towards the range of $68,000 - $69,000. Let's break down what is happening behind the scenes.
1. Technical Analysis: At the Intersection
Technically, BTC is currently testing MA-50 ($69,000) as a crucial support.
Nearest Support: $68,155. If this level breaks, we might see a retest of the liquidity area at $66,500.
Main Resistance: $71,300. A daily candle close above this level is needed to confirm the continuation of the bullish phase towards a new psychological target.
Indicator: RSI is beginning to show overbought conditions on larger timeframes, suggesting a healthy consolidation before the next leg up.
2. Fundamental & Macro Sentiment
Geopolitical Tensions: Tensions in the Middle East (US-Iran) are triggering a spike in crude oil prices (Brent surpassing $108). This raises concerns about global inflation that could force central banks to maintain high interest rates— a negative sentiment for risk assets.
BTC Dominance: At 58.90%, indicating that despite a turbulent market, capital flows remain concentrated in Bitcoin compared to Altcoins which tend to be more pressured.
Institutional Watch: All eyes are on the SEC's decision regarding new crypto ETF applications scheduled for release this week.
3. Trading Strategy (Smart Money Concept)
Observe the Fair Value Gap (FVG) below $68k. Institutions often look for liquidity in this area before re-accumulating. Do not rush to FOMO buy amid macro news uncertainty.

----- > GLOBAL VERSION <-----
Bitcoin $BTC is exhibiting extreme volatility as we close out March 2026. After a strong push to a recent high of $71,290, BTC faced heavy selling pressure, pulling back sharply into the $68,000 - $69,000 range.
Here is the essential global macro and technical breakdown.
1. Technical Analysis: Key Support Under Fire
Technically, BTC is now testing the crucial 50-day Moving Average (MA-50), currently sitting around $69,000.
Key Support Level: $68,155. A decisive break below this could trigger a cascade toward the next major liquidity zone near $66,500.
Key Resistance Barrier: $71,300. This level is acting as stiff resistance. We need a sustained daily close above this mark to invalidate the current correction and resume the bullish trend toward new highs.
Momentum: The RSI on higher timeframes shows signs of cooling off from overbought conditions, suggesting this consolidation is necessary.
2. Global Macro Drivers: The "Risk-Off" Shift?
Escalating Geopolitical Tensions: The situation in the Middle East is rapidly deteriorating, driving Brent crude oil prices above $108/barrel. Rising energy costs are reigniting global inflation fears, complicating central bank pivot strategies and creating a "risk-off" environment.
The Dollar Factor (DXY): Markets are pricing in a potential delay in rate cuts. A strengthening US Dollar is providing headwinds for both equities and crypto.
Institutional Signal (58.9% Dominance): Bitcoin dominance remains exceptionally high at 58.9%. This indicates capital is rotating into BTC as a relative safe haven from Altcoins, rather than exiting the ecosystem entirely.
3. Strategic Outlook: Watching the FVG
Traders should closely monitor the Fair Value Gap (FVG) left below $68k. Smart money often seeks to fill these gaps for optimal entry before a major move. Patience is advised; chasing breakouts in this news-driven environment carries high risk.
🗳️ COMMUNITY POLL:
Where is BTC heading in the next 48 hours?
🚀 Breakout to $73,000+
📉 Deep Correction to $65,000
↔️ Sideways Consolidation ($68k - $70k)
Vote and share your rationale in the comments! 👇
#Bitcoin2026 #MacroEconomics #GlobalMarkets #GeopoliticalImpact #CryptoTrading