In this article, I will explain to you how the Lula government achieved this feat through the nominal deficit.
What does “nominal deficit” mean?
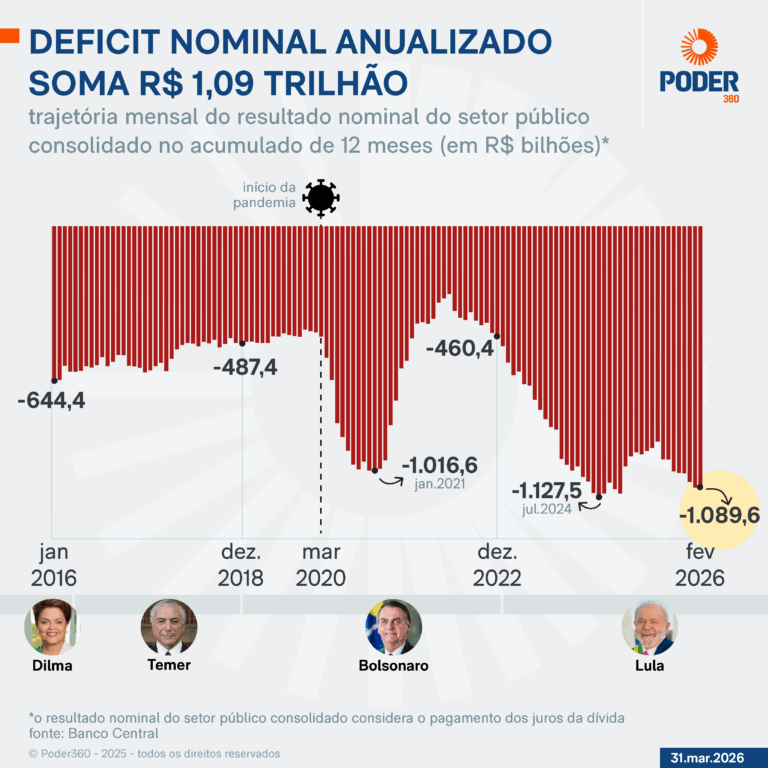
The nominal deficit is the result of the government's accounts already including the payment of public debt interest.
In simple terms:
Nominal deficit = total spending + debt interest – revenue
In other words, it shows how much the public sector (Union, States, municipalities, and state-owned companies) was “in the red” over a 12-month period.
This is different from the primary deficit, which does not include interest.
This point is very important because in Brazil the cost of interest weighs heavily.
The main number of the graph
The biggest highlight is this:
• R$ 1.089 trillion in February 2026
This means that, adding up the last 12 months through February, the public sector accumulated a nominal deficit of approximately:
• R$ 1.09 trillion
It is an extremely high value.
Timeline of the graph
1) 2016–2019: high deficit, but lower than today
At the beginning of the graph:
• January 2016: R$ 644.4 billion
• December 2018: R$ 487.4 billion
During this period there was a high deficit, but still below the current level.
This reflects recession, falling revenue, and high interest rates.
2) Pandemic (2020–2021): explosion of the deficit
The graph clearly marks the beginning of the pandemic in March 2020.
After that, the deficit worsens significantly.
The most critical point was:
• January 2021: R$ 1.016 trillion
This occurred because of:
• Emergency aid
• Health spending
• Credit programs
• Decrease in economic activity
• Strong increase in debt
This jump was an extraordinary effect of the pandemic.
3) Partial recovery (2021–2022)
After the peak of the pandemic, the deficit improves:
• R$ 460.4 billion
This improvement happened because:
• The economy reopened
• Revenue increased
• Emergency spending decreased
4) New deterioration (2023–2026)
Starting in 2023, the graph shows a new deterioration.
It reaches:
• July 2024: R$ 1.127 trillion
Then it improves a little but goes back to being very high:
• February 2026: R$ 1.089 trillion
This shows that the deficit returned to over 1 trillion, close to the worst moment of the pandemic.
What is pushing this number up?
The main factor is the cost of interest on public debt.
The Treasury itself reported that federal debt reached:
• R$ 8.84 trillion in February 2026
The greater the debt and the higher the interest rates, the greater the nominal deficit.
In February, only the appropriation of interest on debt was about:
• R$ 73.9 billion in the month
This helps explain why the nominal deficit remains so high even when the primary result is not so bad.
Important point: nominal deficit ≠ 'lost money'
Many people look at the graph and think the government 'spent 1 trillion more.'
That's not exactly it.
A large part of this value comes from:
• Interest on debt
• Debt rollover
• Monetary update of public bonds
That is, it is not just direct spending on programs and current expenses.
Summary in one sentence
The graph shows that Brazilian public accounts remain deeply deficit when including interest on debt, with the accumulated 12 months in February 2026 reaching R$ 1.09 trillion, a level close to the worst moment of the pandemic.