sol# #SquareMentionsHeatwave #PrivacyNarrativeRising

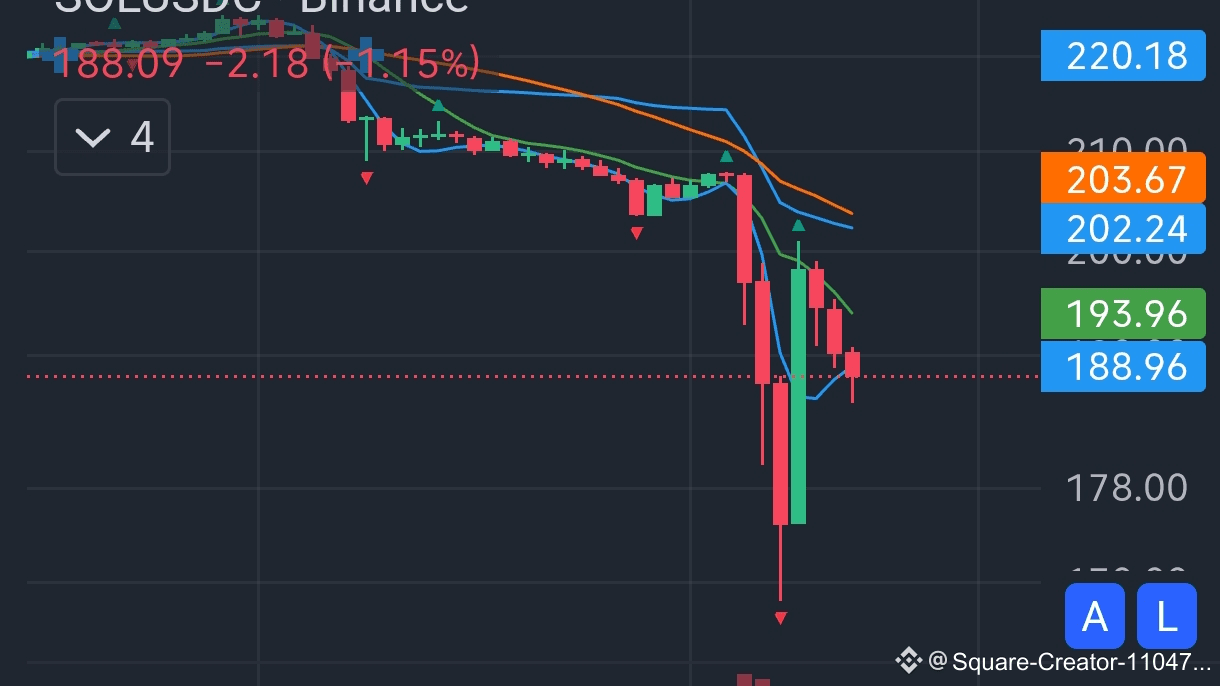
The drop shown in the picture for Solana (SOL/USDC) is very strong (around -14.8%) over 24 hours and is considered a sharp and sudden drop.
Let's analyze it step by step 👇
🔍 Possible reasons for the drop
General market pressures:
If Bitcoin or major currencies like ETH are experiencing a strong decline, then alternative currencies like SOL are affected even more.
The impact of the general market downturn often doubles on currencies like Solana.
Liquidations:
When there is a large number of leveraged traders, meaning long positions, breaking a strong support level can lead to a collective liquidation that increases the sudden drop.
Negative news or technical updates:
Sometimes reports are issued about network outages or technical glitches or delays in upgrades in the Solana network, prompting investors to sell quickly.
Resistance point where the price failed:
The price seems to have failed to hold above the 220 – 230 area, turning into strong resistance that pushed the market to break support at 200, then accelerated the drop.
📉 Quick technical analysis from the picture
Current price: 188 dollars.
Moving averages (colored lines):
The short average (blue) is below the long average (orange), indicating a clear downward trend.
The recent candles are long red with high trading volume → strong entry of sellers.
The RSI indicator at the bottom is very low → oversold, which means that a corrective bounce is possible in the short term.
🔮 Is there hope for recovery?
Yes, but under conditions:
In the short term (hours to days):
✅ It is likely that we will see a corrective bounce towards 195–203 dollars before determining the next direction.
In the medium term (weeks):
⚠️ A real recovery requires the price to return above 220 dollars and hold there.
In the long term (months):
💪 As long as the Solana project is active and has strong technical and community support, the current drop may be a buying opportunity and not the end.