Japanese candlesticks are the simple language of the market. 🧠
Each candle gives you information about price movement over a specific period: where it started, where it reached, and where it ended.
The color is sometimes important, but the most important thing is the shape of the candle and its position on the chart.
This article will help you understand what each candle means without any complexity.
And we will talk about the most important candles that benefit you practically in trading.
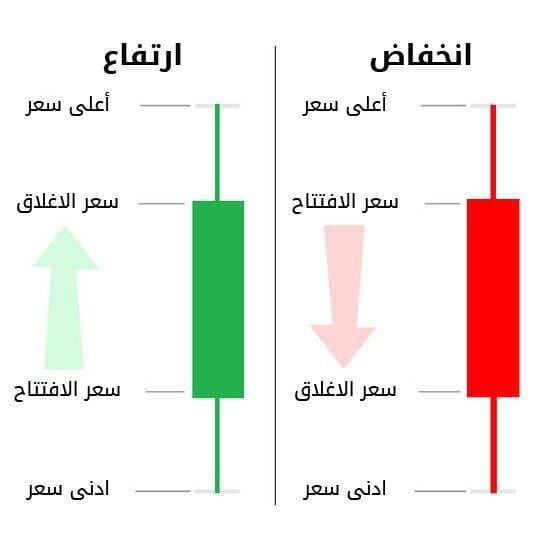
1️⃣ Components of the candle
Each candle has:
🔹️Body: The difference between the opening price and the closing price
🔹️Upper shadow (Line above): The highest price the candle reached
🔹️Lower shadow (Line below): The lowest price the candle reached
The body and shadow tell you who is stronger in the market: buyers (who love to buy) or sellers (who love to sell).
2️⃣ The most important candlestick shapes and their meanings
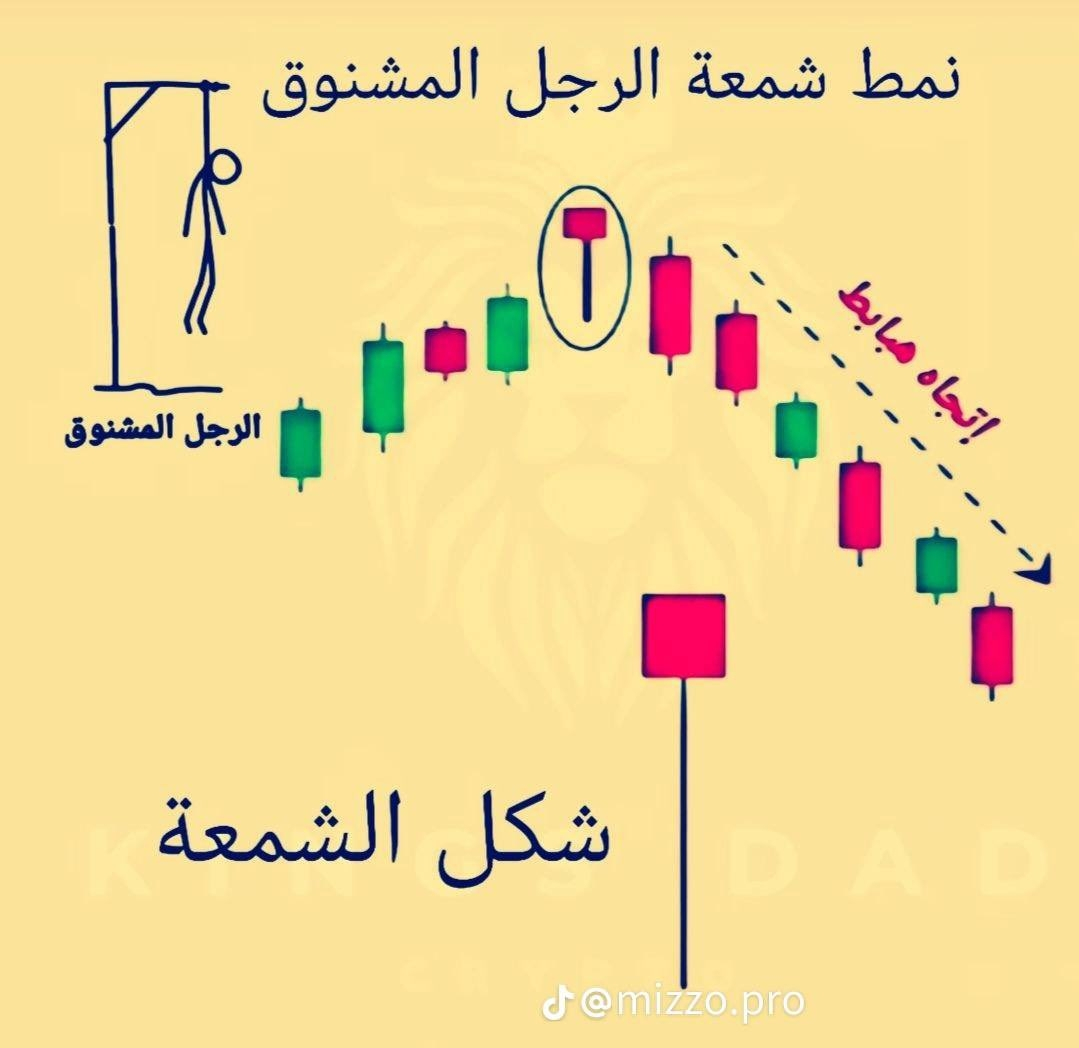
🕯️ Hammer
Shape: Small body with a long shadow below
Color: Green or Red doesn't matter
It means: Buyers tried to push the price up
The strength of the candle increases if it appears at the bottom of the chart
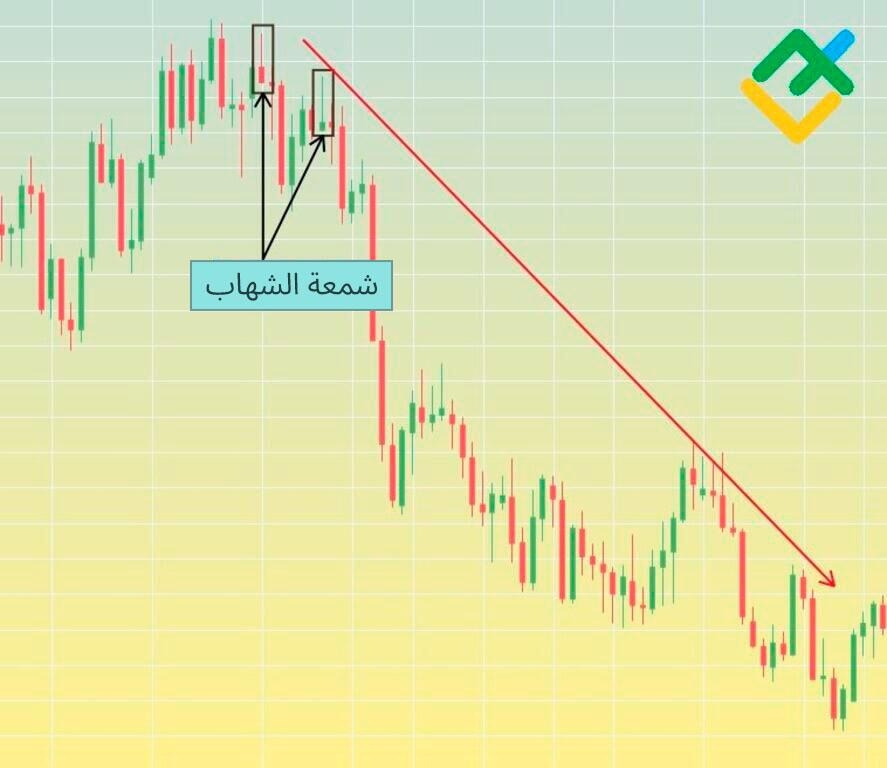
🕯️ Shooting Star
Shape: Small body with a long shadow above
Color: Any color
It means: Sellers tried to push the price down
The strength of the candle increases if it appears at the top of the chart
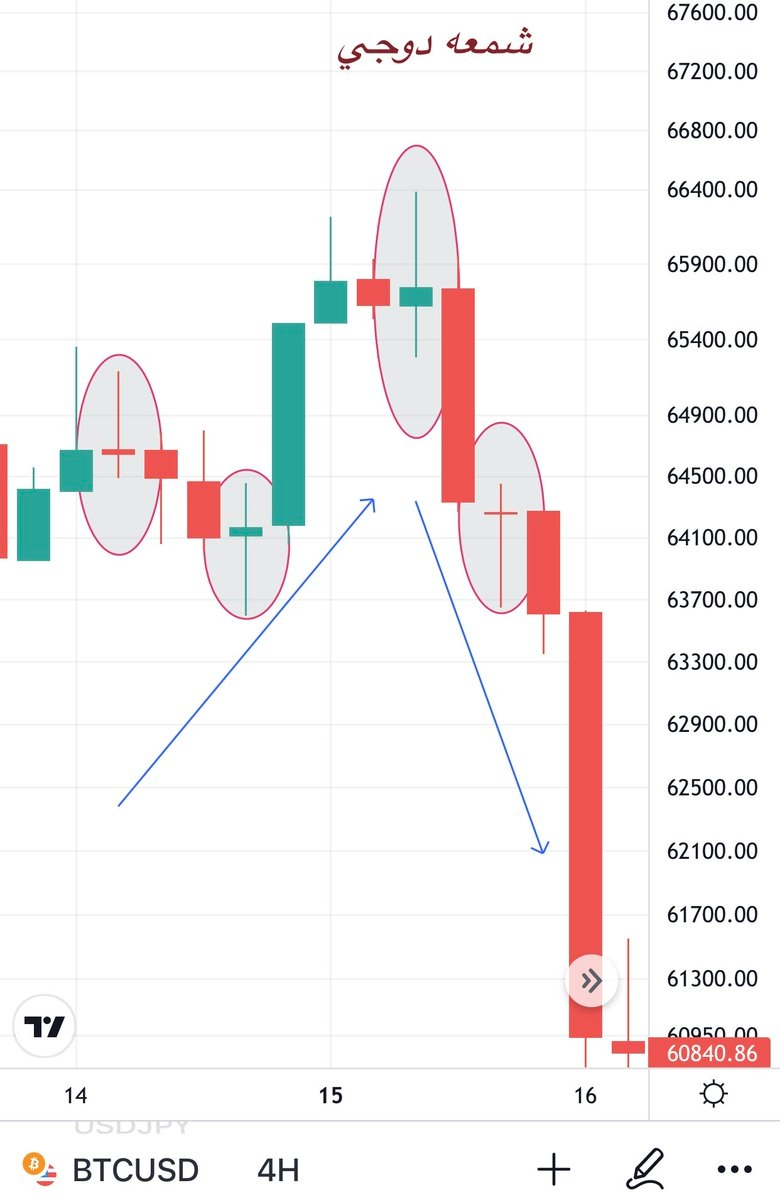
🕯️ Doji
Shape: Very small body, almost the same opening and closing price
It means: The market is confused, not sure where it will go
The strength of the candle increases if it appears at the bottom or top of the chart
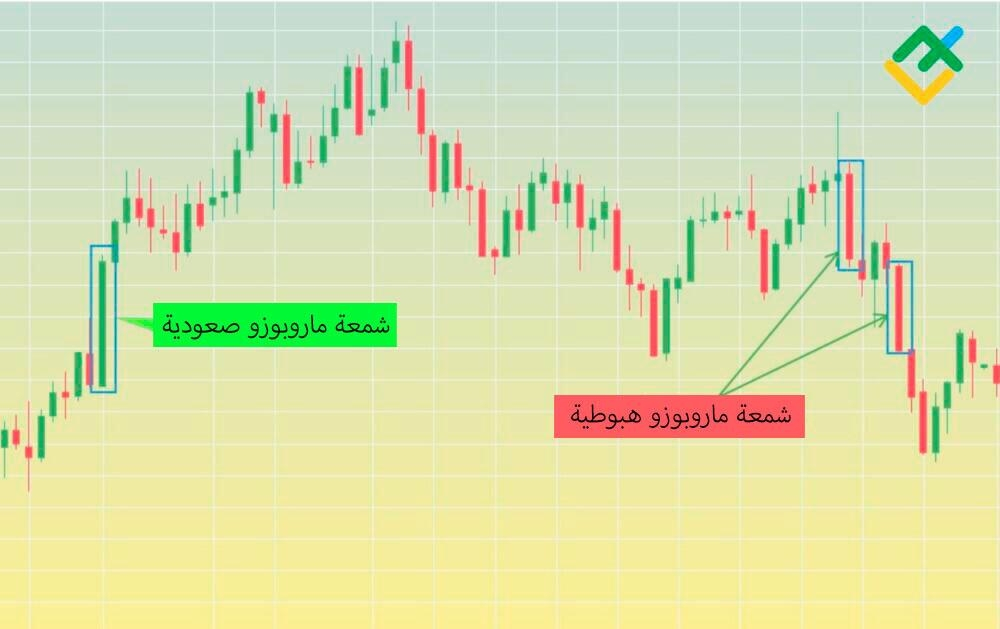
🕯️ Marubozu candle
Shape: Full body without shadow (or very small shadow)
Upward → Buyers are fully in control
Downward → Sellers are fully in control
The strength of the candle increases if it appears at the bottom or top of the chart
3️⃣Implications of long candle wicks:
The presence of long wicks (shadows) in Japanese candles is a strong indication of a fierce struggle between buyers and sellers, concealing important implications based on their location:
1. Long wick from above (Upper Shadow):
* Meaning: Buyers tried to push the price higher strongly, but sellers took control at the end of the session and brought the price down.
* Implication: Indicates weakness in buying power and the possibility of a bearish reversal (especially if it appears at the top of an uptrend), like the "Shooting Star" candle.
2. Long wick from below (Lower Shadow):
* Meaning: Sellers tried to push the price down strongly, but buyers intervened powerfully and raised the price before the close.
* Implication: Indicates a rejection of the price to drop and the possibility of a bullish reversal (especially if it appears at the bottom of a downtrend), like the "Hammer" candle.
3. Long wicks from both sides:
* Meaning: Very high volatility and a lot of confusion in the market.
* Implication: No side is in control (neither buyers nor sellers), and it often appears in a "Doji" candle, serving as a signal for a potential change in direction or a period of sideways fluctuation.
In short: The long wick represents a "rejection" of the price level that the wick reached, serving as a warning that the current momentum may be weakening.
4️⃣ The location of the candle on the chart is the most important
Bottom of the chart = The lowest price the price has reached
→ Candle at the bottom → Likelihood of price increasing (like the Hammer candle, its color doesn't matter)
Top of the chart = The highest price the price has reached
→ Candle at the top → Likelihood of price dropping (like the shooting star, its color doesn't matter)
Candle in the middle of the chart → The strength of the candle is weak
→ It means the market might move a little but without a clear direction
Example: If you see a Doji or Hammer in the middle of the chart, the color doesn't matter, and it means not strong.
The same candle at a bottom or top → means stronger, and the likelihood of price movement is greater.
4️⃣ Tips for beginners
Focus on the location of the candle on the chart more than the color
Note the repetition of candles at the same top or bottom
Try applying on Binance or any cryptocurrency
The more you understand the candles and their locations, the more confidently you will know how to move in the market
In the next article, we will discuss candlestick patterns that indicate whether the price will continue or revert, in a very easy way for beginners 🚀
🏷If you want additional clarification, leave your question in the comments....?
