After we understood the shapes of candles 👌
Now we need to understand something important:
👌 Not every candle alone is sufficient
👌 Sometimes we need to look at more than one candle together
And this is where:
🔥 Candle Patterns (Patterns)
🔴 First: Patterns indicating that the price may revert (reverse direction)
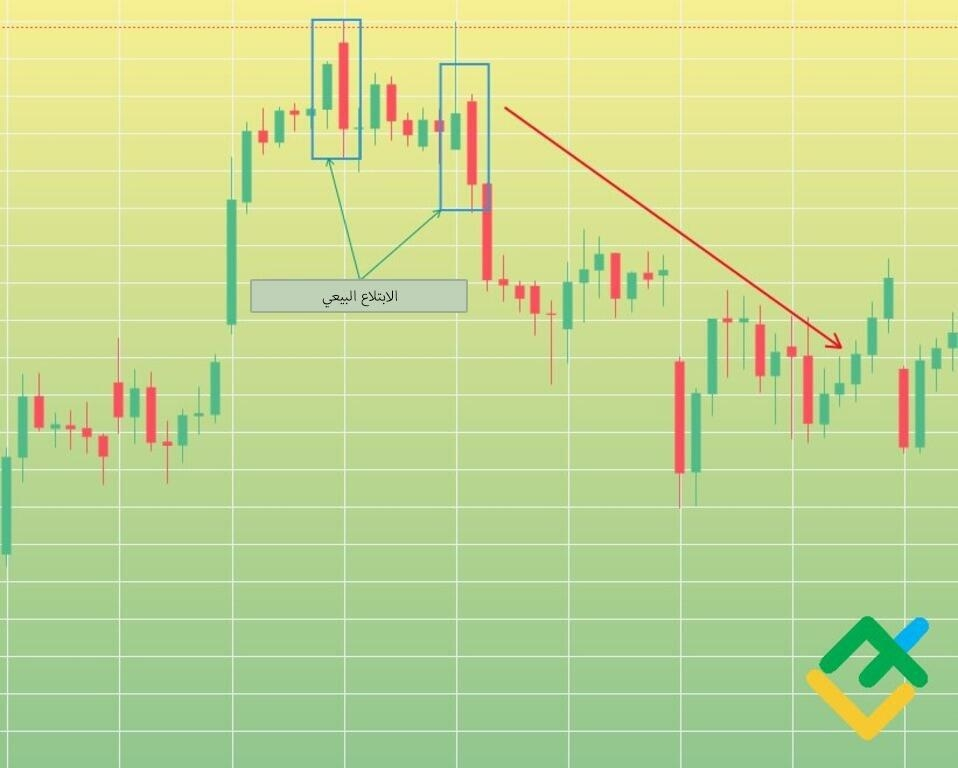
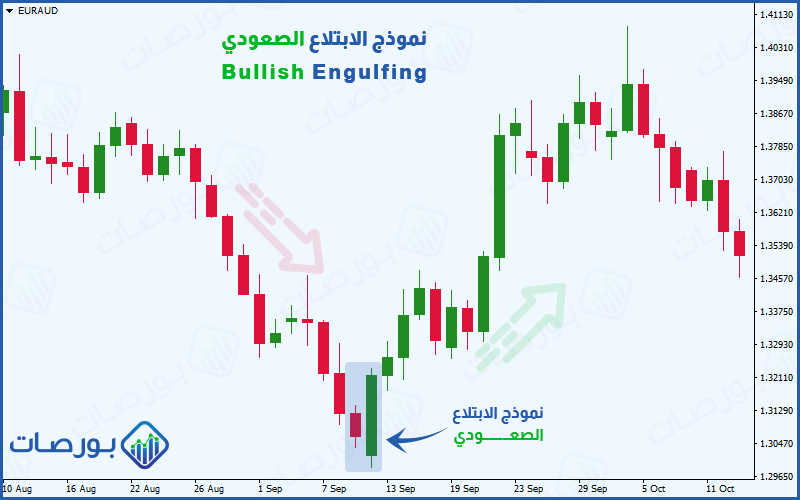
🕯️ 1. Engulfing Pattern
Shape:
Two candles:
the first is small
the second is large and completely covers it
Meaning:
If the price was dropping 📉
And a large bullish candle appeared
👉 Buyers are in control → the price might rise 🚀
If the price was rising 📈
And a large bearish candle appeared
👉 Sellers are in control → the price might drop ⛔
📌 Example:
The price is down and reached a bottom → a large candle appeared covering the previous one
👉 Possible start of an upward trend
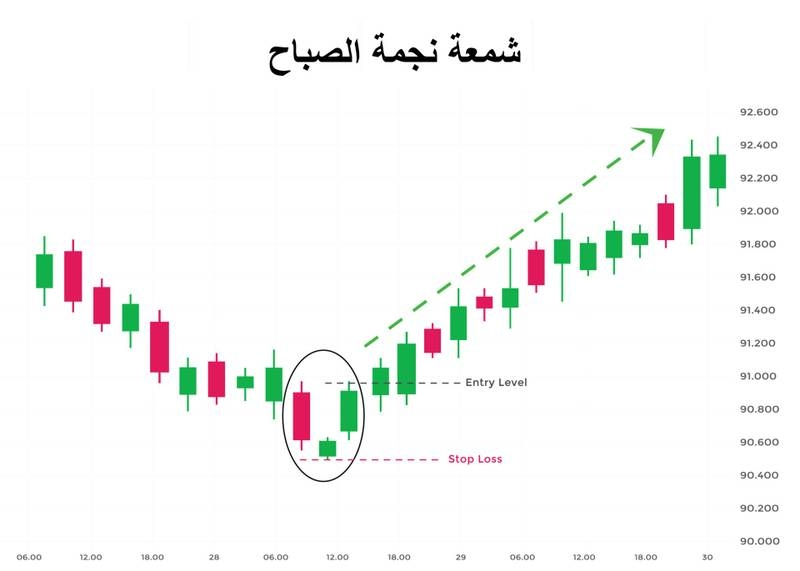
🕯️ 2. Morning Star pattern
Shape:
3 candles:
Bearish candle
Small candle (indecision)
Strong bullish candle
Location:
At the bottom of the chart
Meaning:
The market was dropping... stopped... and then started to rise
👉 Possible rise 🚀
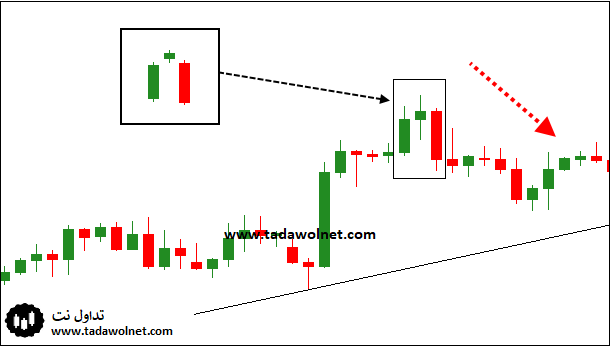
🕯️ 3. Evening Star pattern
Shape:
3 candles:
Bullish candle
Small candle
Strong bearish candle
Location:
At the peak of the chart
Meaning:
The market was rising... stopped... and then started to drop
👉 Possible drop 📉
🟢 Secondly: Patterns indicate that the price might continue in the same direction
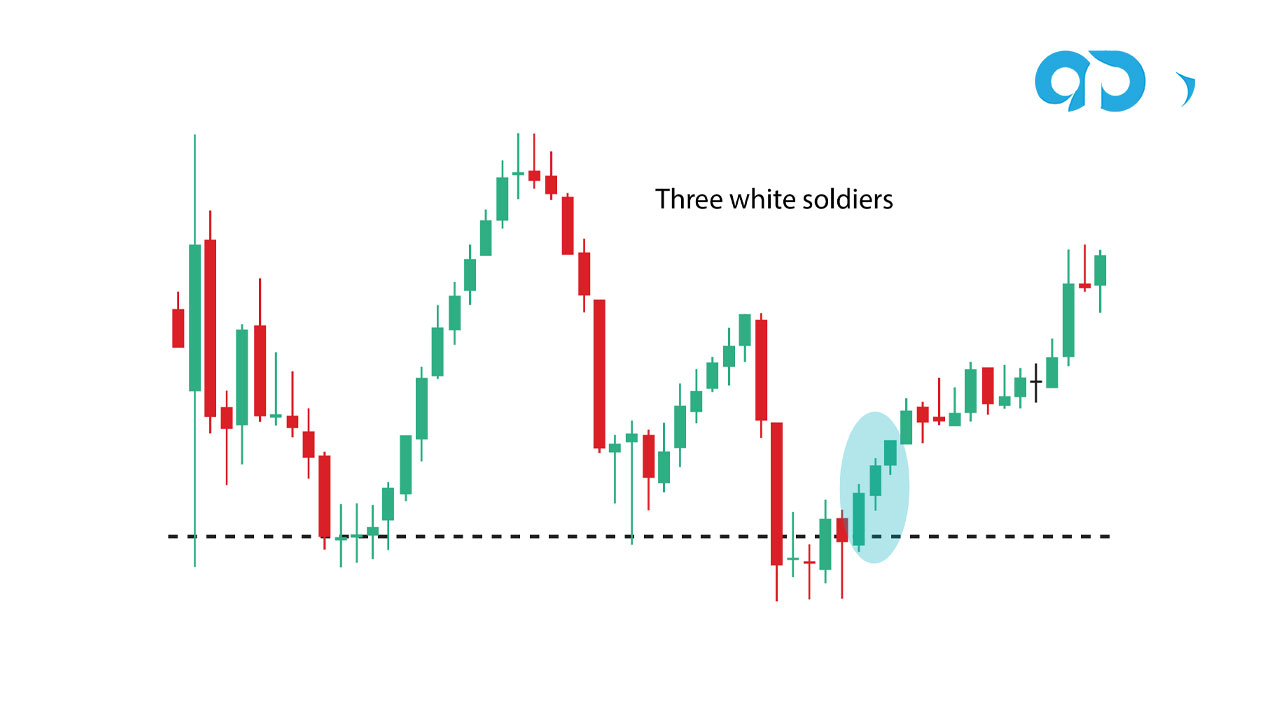
🕯️ 1. Three White Soldiers pattern
Shape:
3 consecutive bullish candles
Meaning:
Buyers are strongly in control 💪
👉 The price is likely to continue rising
📌 It's best to see it after the start of an upward movement
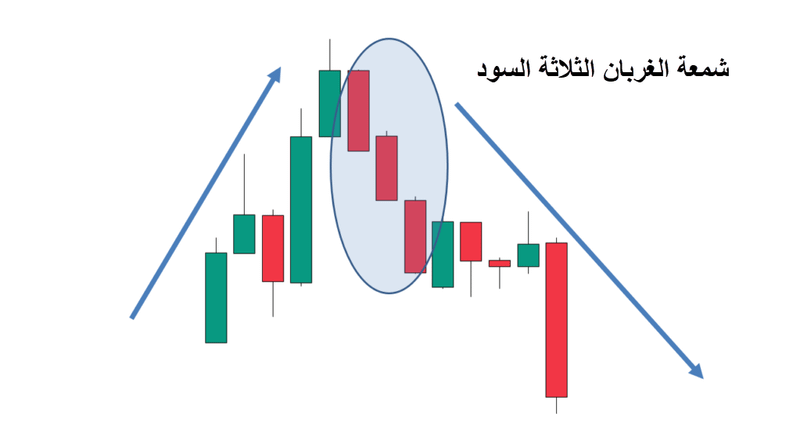
🕯️ 2. Three Black Crows pattern
Shape:
3 consecutive bearish candles
Meaning:
Sellers are in control 😈
👉 The price is likely to continue dropping
⚠️ Most important point (focus here well)
❗ The same pattern can fail if it is in the wrong location
Example:
Morning Star at the bottom → Strong ✅
The same pattern in the middle of the chart → weak ❌
👉 It means:
The location on the chart is more important than the pattern itself!
🧠 Tips for beginners
Do not memorize patterns without understanding ❌
See them on the real chart
Focus: Peak or bottom? 📍
Apply it yourself on Binance
🎯 Summary
In patterns that tell you: the price might return 🔄
And in patterns that tell you: the price might continue ➡️
📌 The location is fundamental in everything👌
🔥 In the next article:
We will enter the peaks and troughs 🏔️
And here... you start to see the market through the eyes of a 'real trader', not a beginner 😏
