As a cryptocurrency trader, monitoring the market every day is not just staring at K-lines. Taking this $ETH 1-hour chart as an example, let's analyze what key information is hidden in the 'market monitoring vision' of professional traders.
One, keep an eye on 'trends and structures': direction is the soul of trading 👻
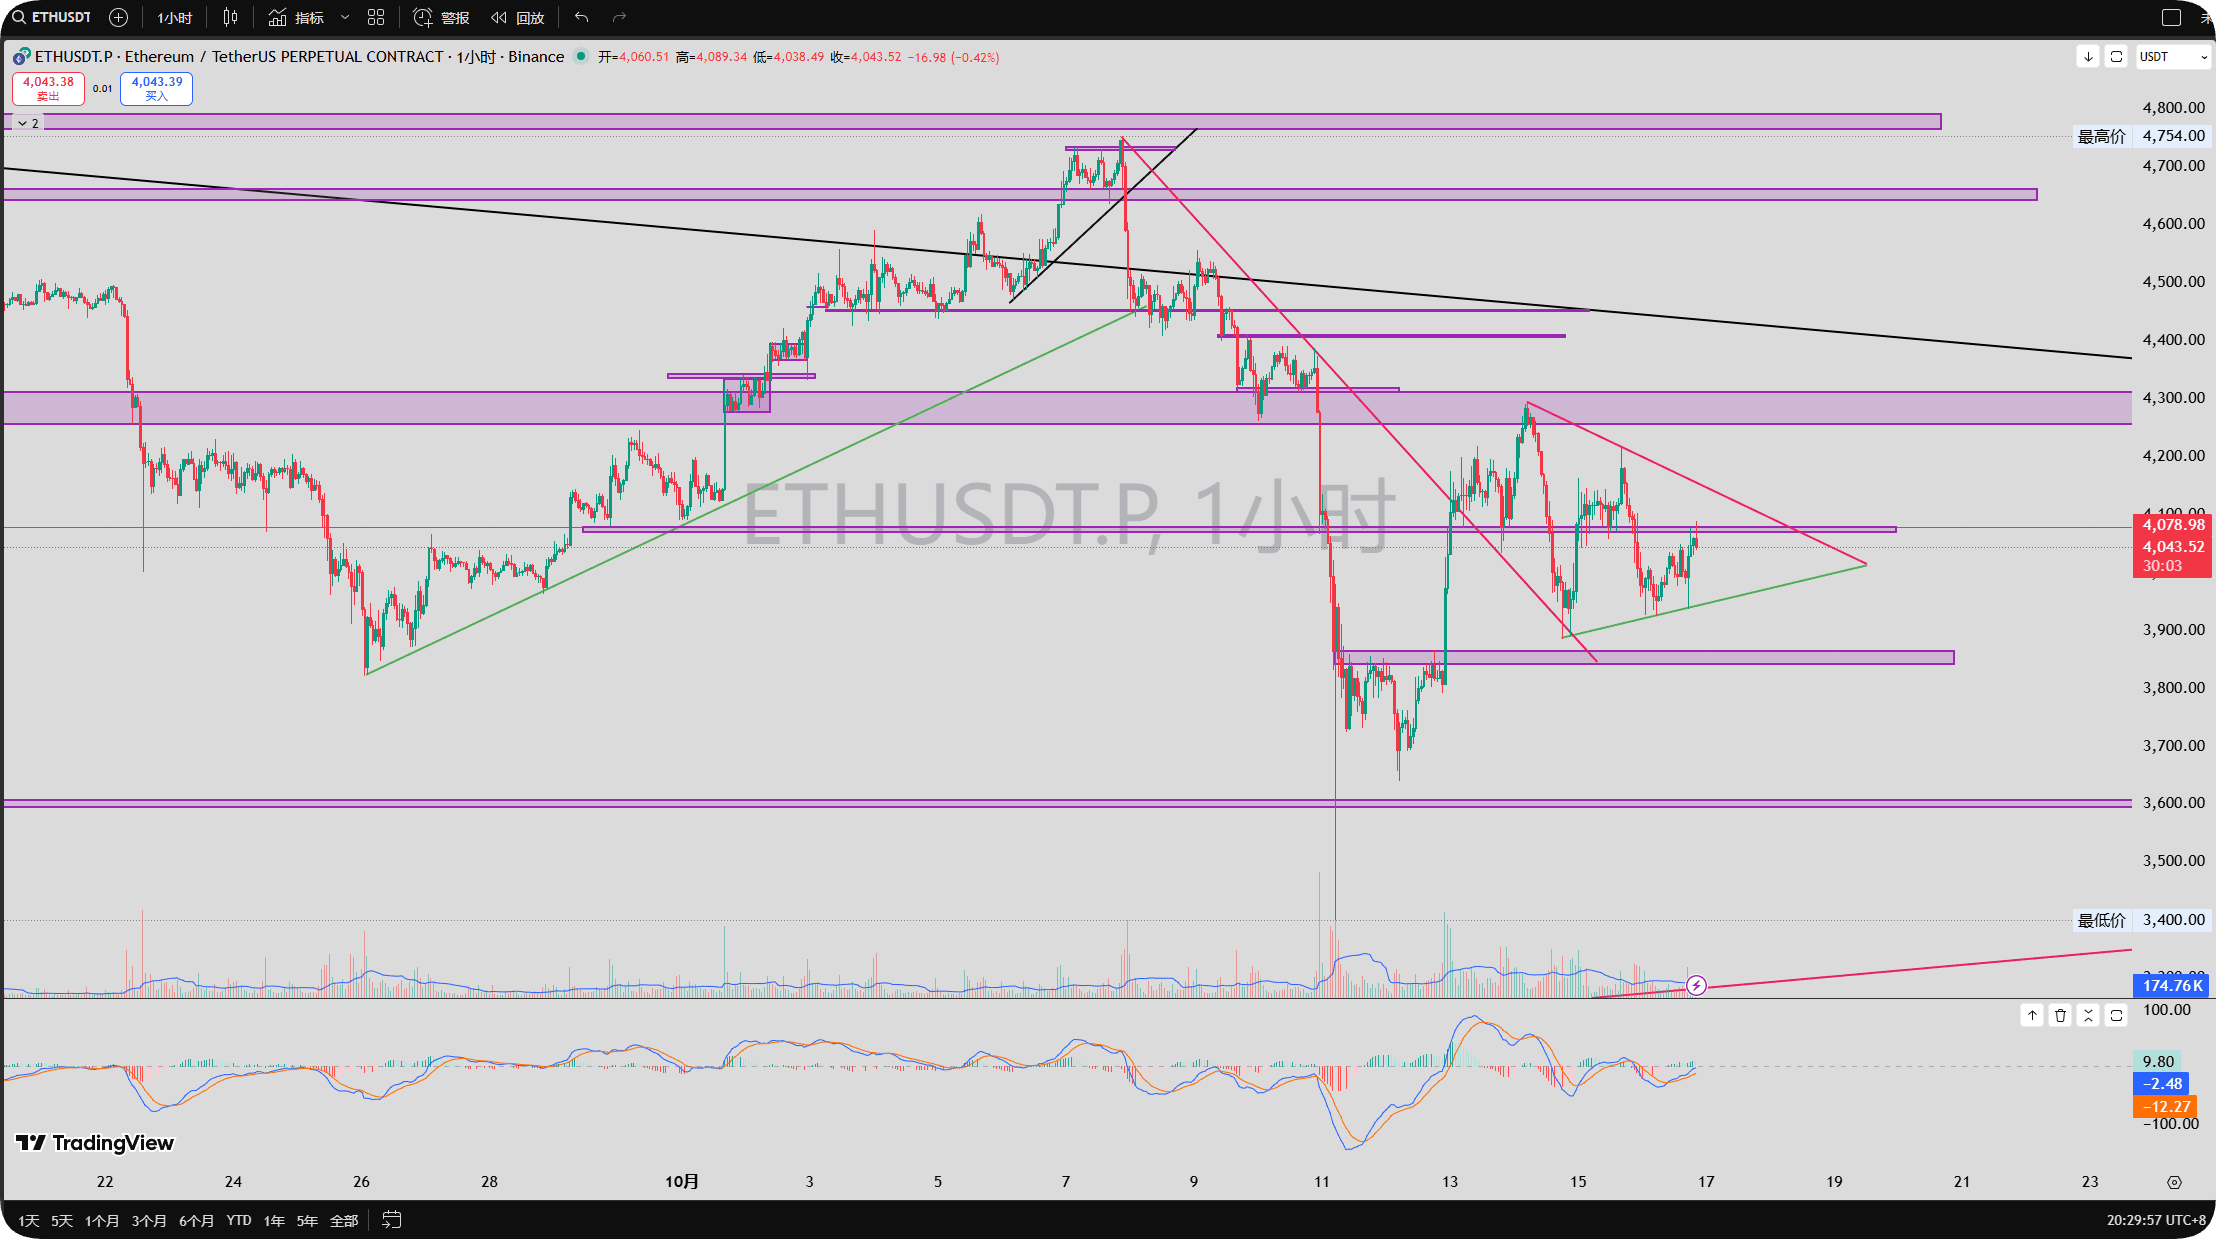
Open the market chart, the first step is to look at the trend framework. The trend of ETH in the chart can be clearly seen:
There is a rising trend line (green line) supporting the rise, accelerating after breaking through key resistance;
After reaching the peak, a declining trend (black line) is formed, followed by a triangular consolidation structure (formed by red and green lines) at a low level.
These 'lines' and 'shapes' are not drawn randomly — the rising trend line represents the continuation of bullish momentum, the declining trend line suggests bearish dominance, and the triangular consolidation is the 'accumulation phase' of the tug-of-war between bulls and bears, with the breakout direction often determining the short-term market direction.
Two, keep an eye on 'key support and resistance': anchor points for buying and selling 👈
The purple horizontal areas in the chart are the support and resistance levels (also called 'key price zones') in the eyes of traders.
For example, the purple area near 4300 is both a 'springboard' for the previous rise and a 'strong support' after a pullback;
The area around 3900 is the 'bull defense line' after the decline; breaking below or holding above will trigger market volatility.
These price levels are the 'battlefield' of capital games — breaking below support will accelerate the decline as bulls stop loss and leave; breaking above resistance will push up as bears stop loss. Traders' entries, stop losses, and take profits are mostly planned around these points.
Three, keep an eye on 'volume and indicators': a thermometer for capital and sentiment 💥
The trading volume and technical indicators below (such as the 'sentiment curve' indicator in the chart) are key for traders to judge the 'truth of the market':
Breakouts during increased trading volume are often 'true breakouts', with real capital entering; if the trading volume is sluggish, the breakout may be 'false bullish / false bearish';
Technical indicators (such as oscillators) can indicate 'overbought and oversold', assisting in judging whether the market has reached a 'turning point zone'.
Four, keep an eye on 'market linkage and news': a must for a global perspective 🐳
Of course, monitoring the market is not just about looking at a single cryptocurrency. Traders also pay attention to:
The trend of Bitcoin (the 'big market' in the crypto world), ETH, as a mainstream coin, often moves in conjunction with BTC;
Industry news (such as regulatory dynamics and actions from large institutions) can directly impact market sentiment, which is then reflected in the K-line structure.
In summary, traders monitor the market within the logical chain of 'trend structure → key price levels → volume indicators → global linkage', seeking trading opportunities with 'high win rates and high profit-loss ratios'. The seemingly dull K-line charts are, in the eyes of traders, the 'battlefield map' of capital games, where every K-line and every indicator is a 'signal flare' for decision-making.
Want to analyze the market like me and grasp trading rhythms? Follow Heishe @黑手Garry every day to penetrate the K-line fog and understand the underlying logic of cryptocurrency trading!

