After we understood the candles and patterns of reversal and continuation 🕯️🔄
It's time to understand peaks and troughs in a very practical way! 💡
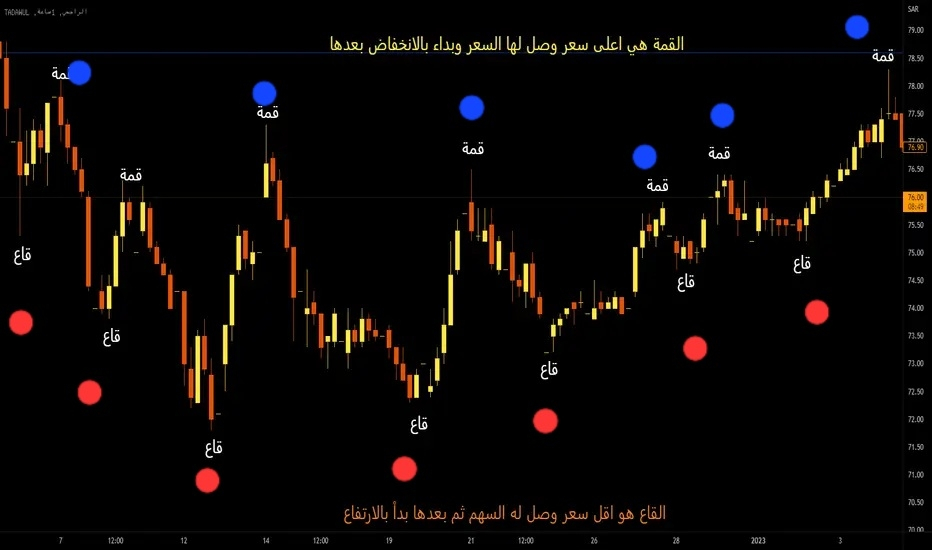
❗ Peaks and troughs are not difficult terms, but they are the basis for reading the market:
Peak = The highest price the market has reached 📈
Trough = The lowest price the market has reached 📉
1️⃣ Why are peaks and troughs important?
It helps you know the general direction of the price 🧭
It clarifies natural support and resistance areas ⚡ (without complicated terms: trough = support, peak = resistance)
It makes understanding candles and reversal and continuation patterns easier 🕯️🔄
📌 Practical example:
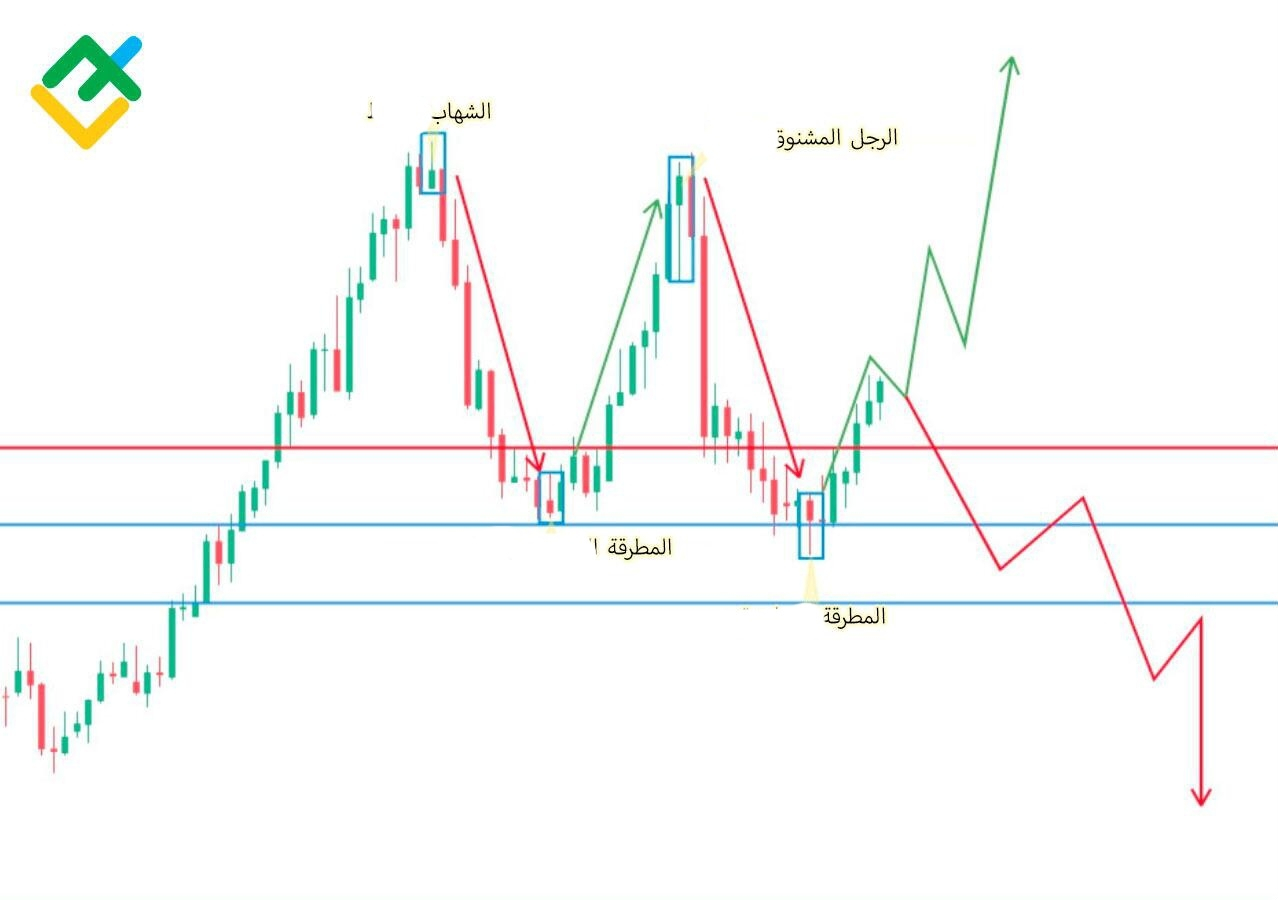
Hammer candle at a trough → price uptrend probability 🚀
Shooting star candle at a peak → price downtrend probability ⛔
2️⃣ Types of peaks and troughs
🔹 Double Top
Shape: the market hit the same peak twice and couldn't rise further
Meaning: price downtrend probability 📉
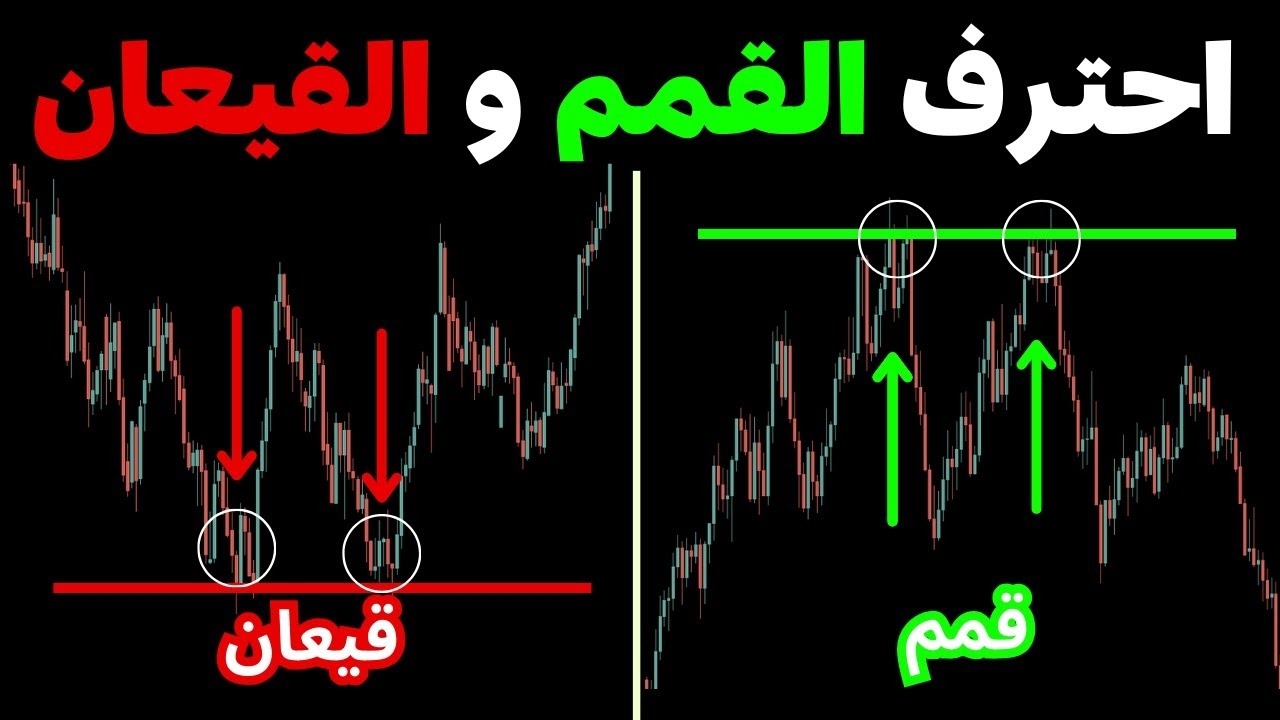
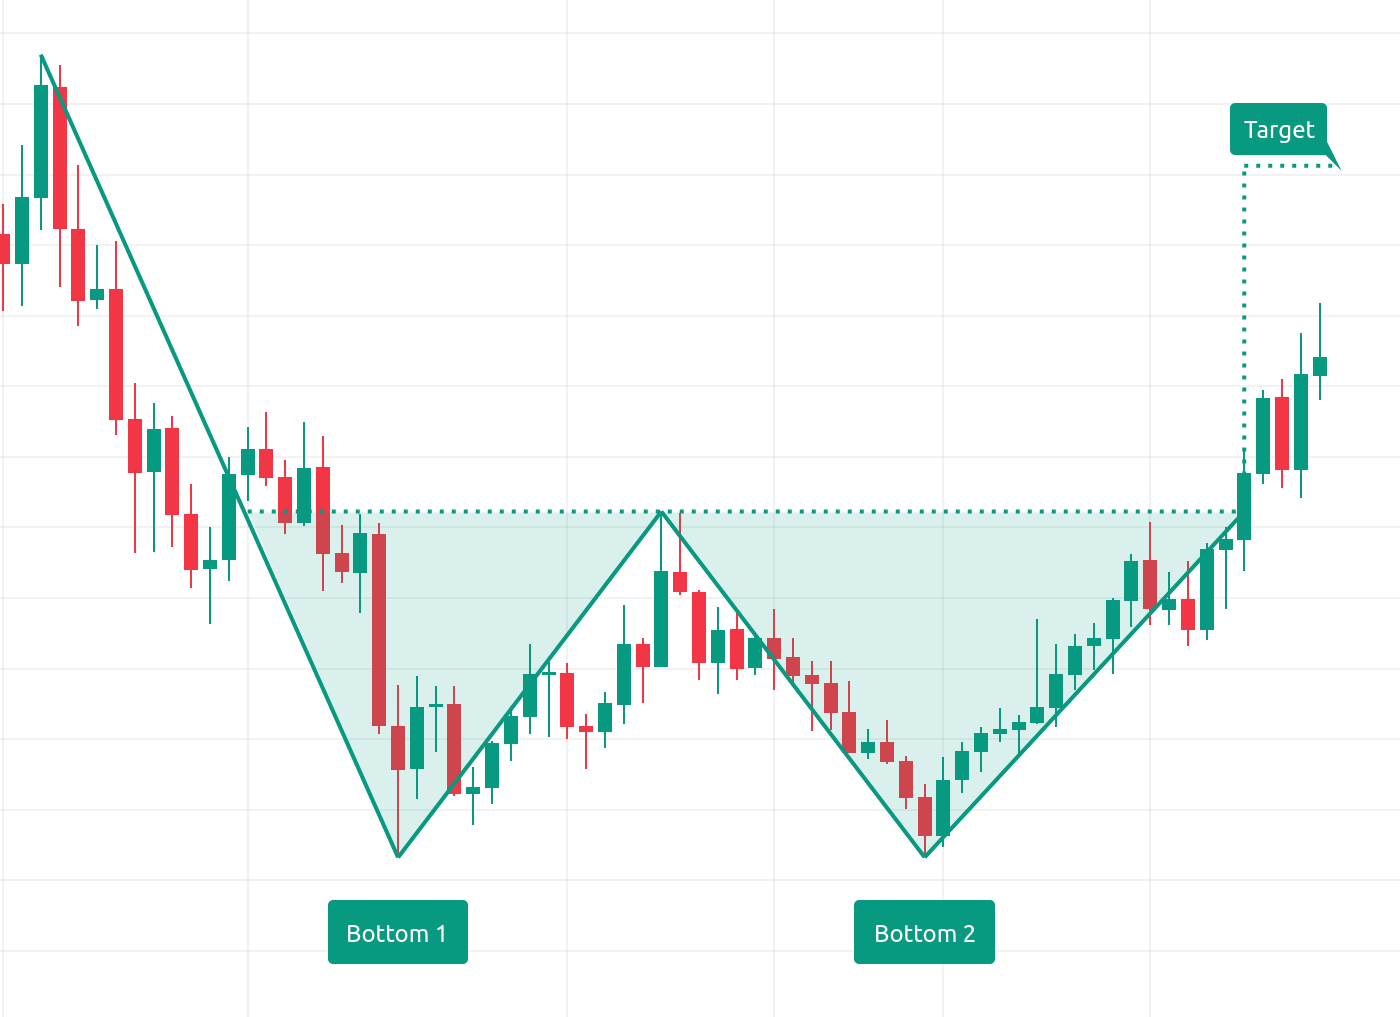
🔹 Double Bottom
Shape: the market hit the same trough twice and couldn't drop further
Meaning: price uptrend probability 🚀
🔹 Consecutive peaks and troughs
The market is making a new peak + new trough
Meaning: the trend is clear, the price will likely continue in the same direction ➡️
4️⃣ Linking peaks/troughs with candles
Hammer candle at a double trough → strong signal for price uptrend 💪
Shooting star candle at a double top → strong signal for price drop ⛔
Engulfing candles at peaks/troughs → confirmation of reversal
⚠️ Most important rule
❗ If the peak or trough isn't accurate or correct on the candlestick → patterns might fail
👉 You need to see the complete sequence: peak/trough + pattern + candle
🔹 Summary
Peaks and troughs = market map 🗺️
Drawing it practically will give you more accurate predictions
Combining it with candlesticks and reversal and continuation patterns gives you greater strength in decision-making 💪
A beginner applying these basics will be able to understand the market, not just memorize shapes
