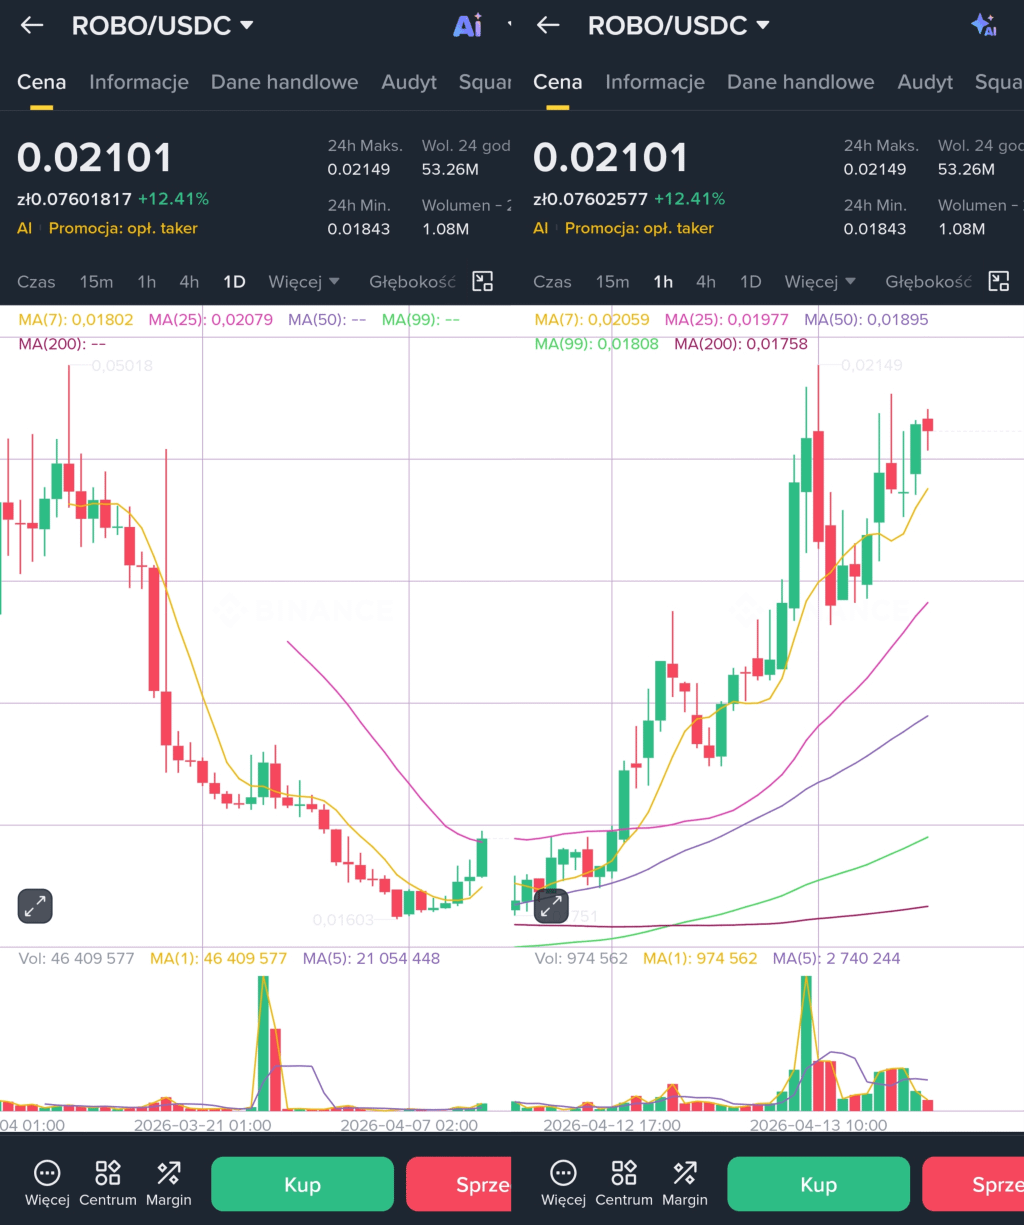
Analysis D1 of the ROBO/USDC pair (based on image_10.png and image_11.png) shows strong demand revival after a long period of consolidation. The price has broken through all key moving averages (MA7, 25, 50, 99) in a dynamic five-candle bullish movement. The peak from D1 (D1_Max) is currently being tested around 0.02150 USDC, which technically favors bulls in the near term, but at the same time signals a supply zone.
SCENARIO A (BULLISH)
Continuation of dynamics and a clean breakthrough of the level 0.02150 USDC may open the way to testing higher resistance zones (e.g., the psychological barrier of 0.02300 USDC), if demand maintains control.
SCENARIO B (BEARISH)
Rejection of the price by resistance at 0.02150 USDC may trigger profit-taking. The first support zone is the local low (~0.01950 USDC) and the overlapping MA(7) and MA(25). Breaking through these levels would indicate a weakening of the bullish momentum.
RISKS
The main risk is high volatility resulting from relatively low volume (53.26M $ROBO ) and the risk of a "false breakout" above the peak if not supported by strong trading volume.
You can find more details about this project on my profile.
13.04.2026 TA Analysis | Always DYOR
This is not investment advice.
#FabricProtocol #analisis #BinanceSquare #BinanceSquareFamily #defi