Dear beginner, how do you understand the #RSI indicator and know its buying or selling potential?
Look, my dear / and you too, my dear 😵💫
Or I say, withdraw the word 'dearest' to avoid problems and so on.
The important thing is... come with me, my dear 😍
Have you seen this RSI indicator?! It has strange and amazing numbers.
How many of them avoid seeing it.
I agree with you, numbers as many as the hair on the head 😂😢
But
Trading professionals have been giving us headaches every day
This one is rising and this one is falling
This one has strong momentum, that one is retreating, and this one is going down
Buy here and leave it, sell here
They drove us crazy, made them for the jinn… burned our livers
The important thing is to ignore them… stay with me
Listen, my dear … this indicator is important
I don’t say it will take you to space and you will discover galaxies
No, you smart one, stay aware
This indicator allows you to see more than before
It means you understand a little, not strongly, just a little
When to buy and when to sell
But I won’t advise you, nor will I say it’s guaranteed
This indicator scores from 0 to 100
It has 4 levels, and professionals also divide it into 4 levels
1. Level (0-30) is oversold
The price has dropped significantly, and it may start to rebound upward (potential buying opportunity)
2. Level (30-50) Weakness / Neutral
The trend is down or unstable after the drop
3. Level (50-70) is a healthy upward momentum
Buyers are in control, and the market is in a moderate upward trend
4. Level (70-100) is overbought
The price has risen sharply, and the possibility of a near-term downward correction
🔹Professionals interpret the signals as follows:
1. Rises above 70 and then starts to drop: A signal of the near end of the upward wave.
2. Drops below 30 and then starts to rise: A signal of the near end of the downward wave.
3. Crosses the 50 line upward: Confirmation of the beginning of an upward trend.
4. Crosses the 50 line downward: Confirmation of a downward trend.
5. Divergence between RSI and price: An early sign of trend reversal
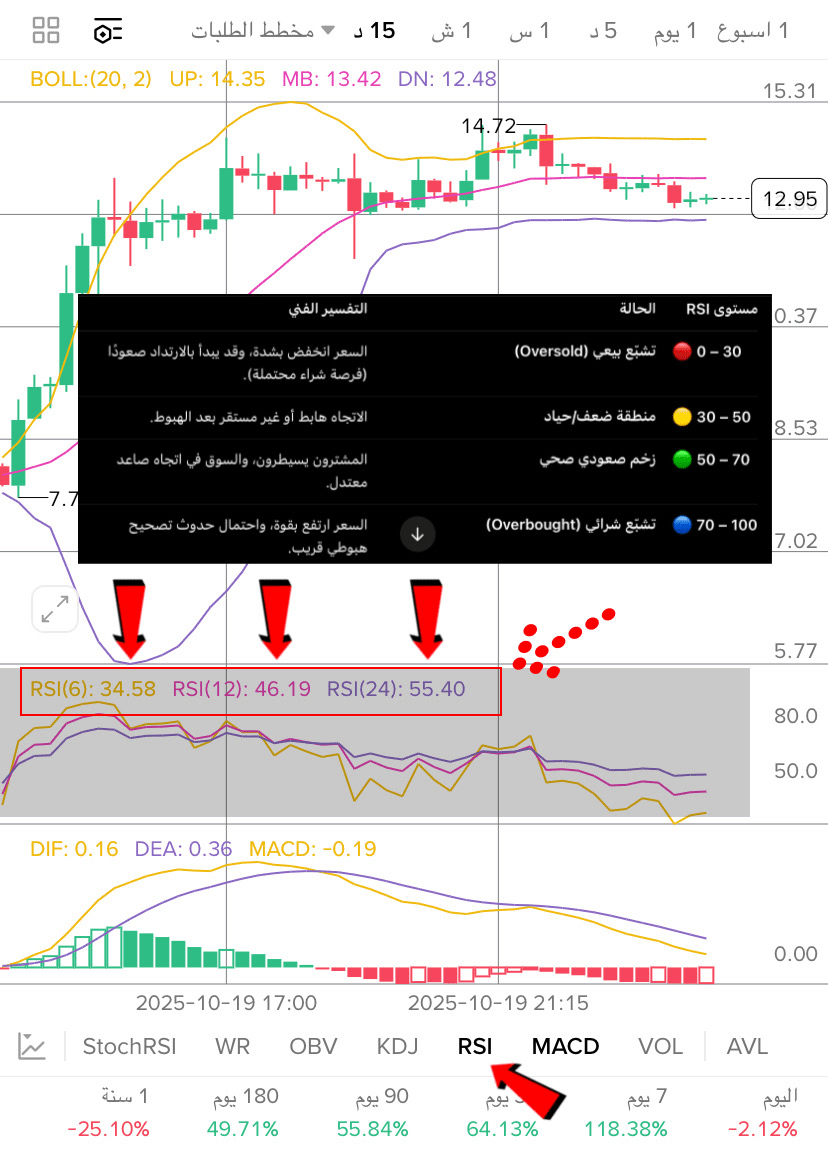
How to read RSI practically
RSI(6) = 83.5 ⟶ Very strong overbought
RSI(12) = 63.2 ⟶ Healthy upward momentum
RSI(24) = 46.7 ⟶ The trend is still improving gradually


