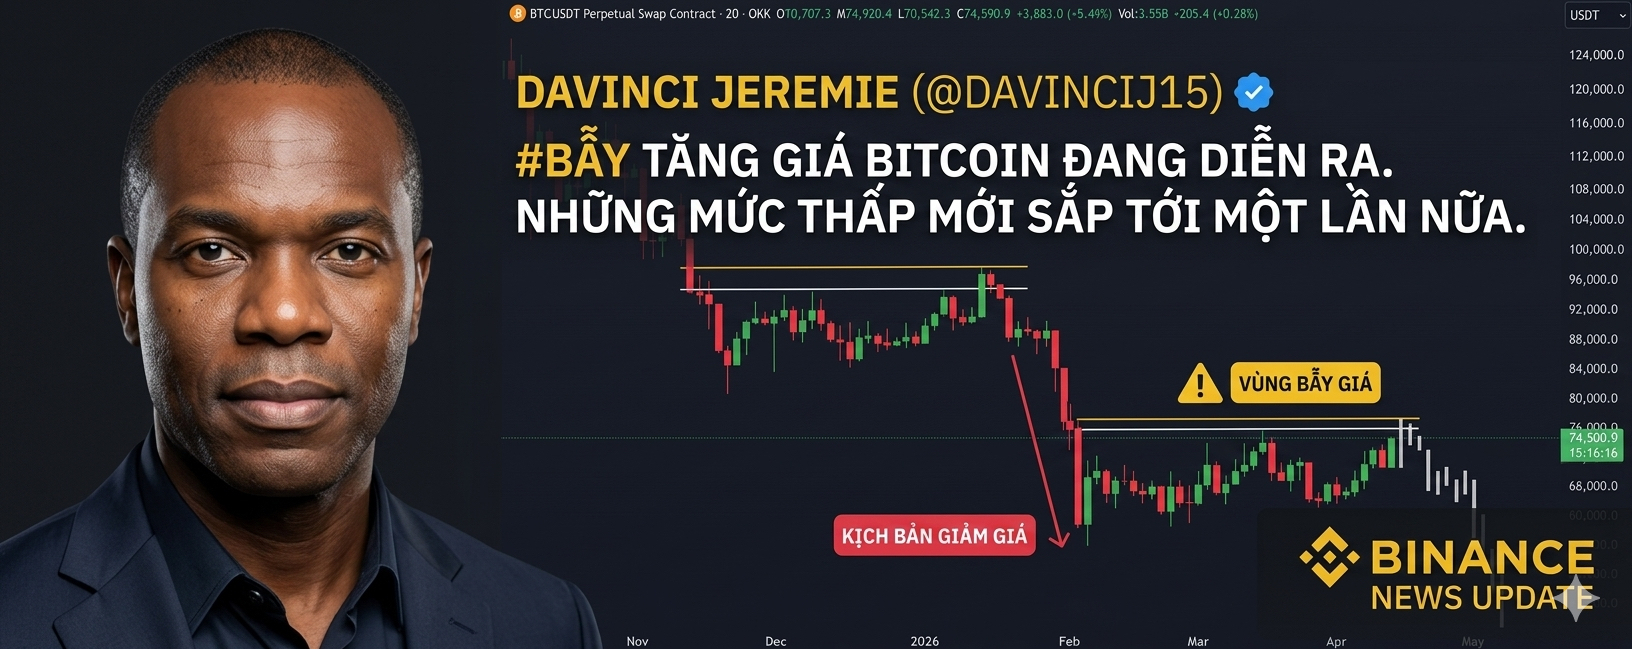
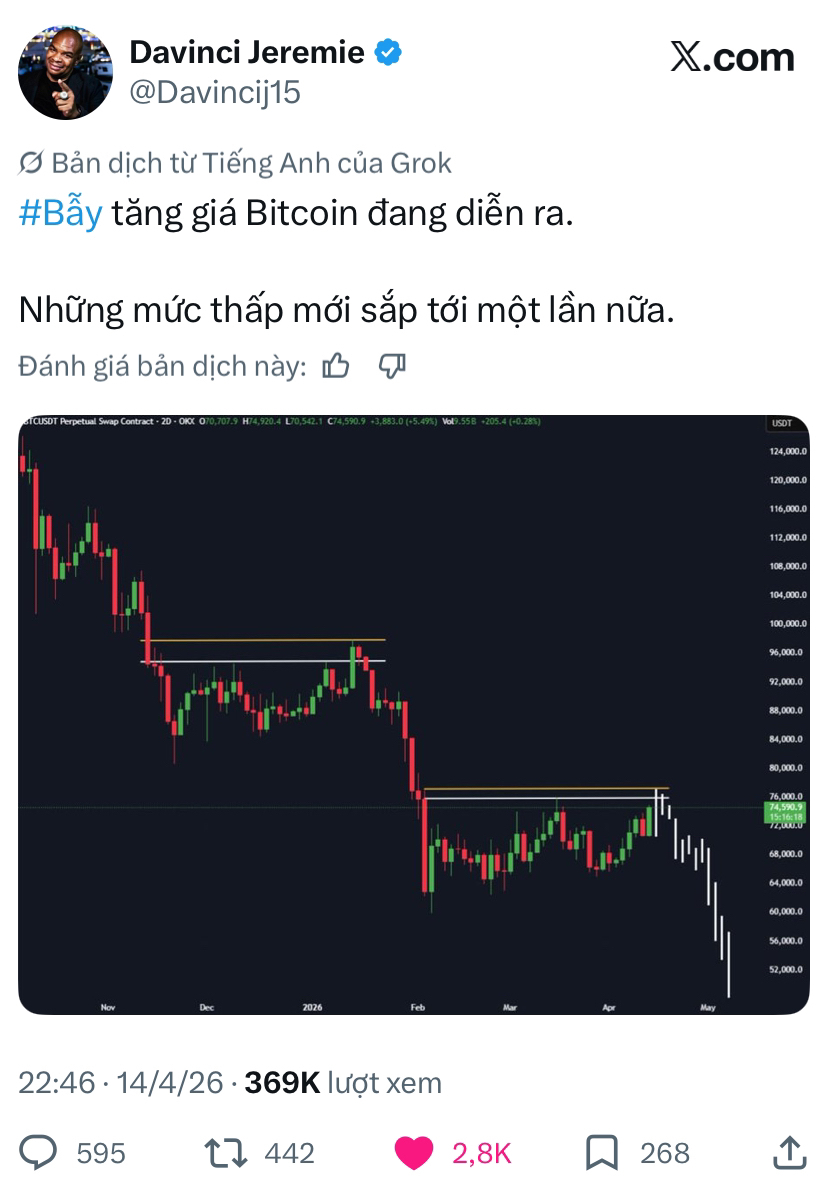
Today, a rather "sharp" perspective from the famous KOL Davinci Jeremie is attracting significant attention in the X (Twitter) community. According to the analysis from the 2D chart of the BTC/USDT pair, we are facing signs of a very dangerous Bull Trap.
Quick analysis from the chart:
• Strong resistance zone: Bitcoin has had recovery phases testing the price range around $74,500 - $76,000, but there have been continuous appearances of wick candles, indicating that the selling pressure here is still very strong.
• Discount structure: After a sideways phase, the chart is painting a scenario of "free fall" if the price cannot hold the key support levels. According to the prediction in the image, the next target could retreat deep into the range of $52,000 - $60,000.
• Market sentiment: Small bounce waves often excite new investors to "buy in", but this is exactly when the "sharks" set traps to liquidate long positions before pushing prices down further.
Advice for everyone:
In this sensitive market phase, capital preservation is the top priority. Be patient in observing support levels and limit the use of excessive leverage.
What do you think about this scenario? Will BTC find a new bottom or is this just a "shaking the tree to scare the monkey" phase?
#Bitcoin #BullTrap #CryptoAnalysis #MarketUpdate