
In the past few cycles, observing the relationship changes between cost basis and price behavior is one of the best perspectives to see BTC emerging from its bottom structure.
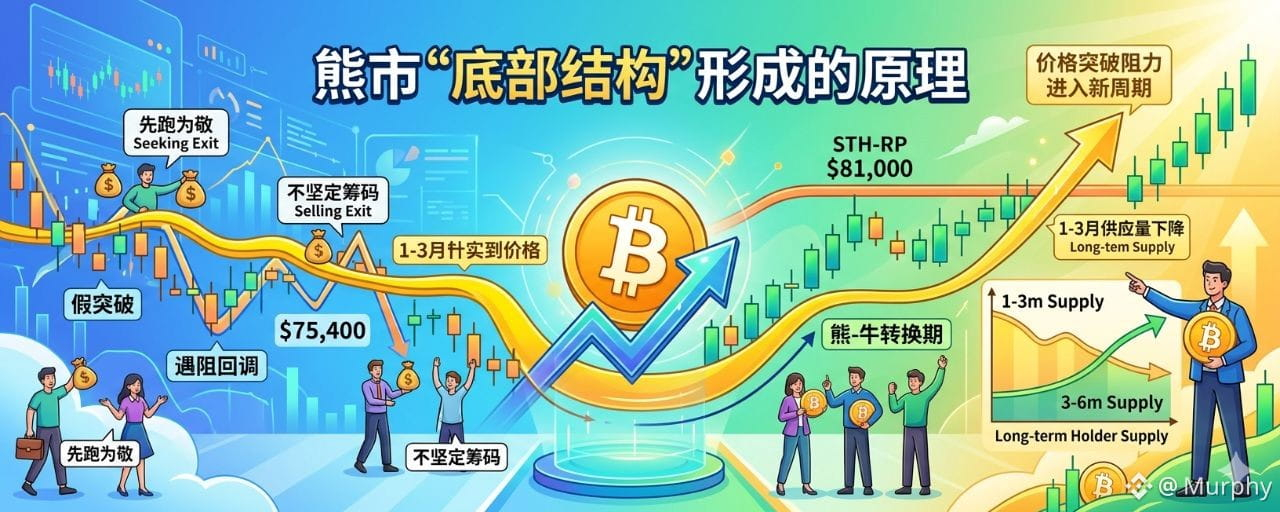
The logic here is that when the price enters the cost range of a certain group of BTC holders, the price movement behind it represents the behavior of that group. Is it 'run first to show respect' or 'continue to hold'?
If it is the former, the price will encounter resistance near the cost line; if it is the latter, the price can smoothly break through the cost resistance. If the price oscillates around the cost line, it means the market is entangled and negotiating repeatedly.
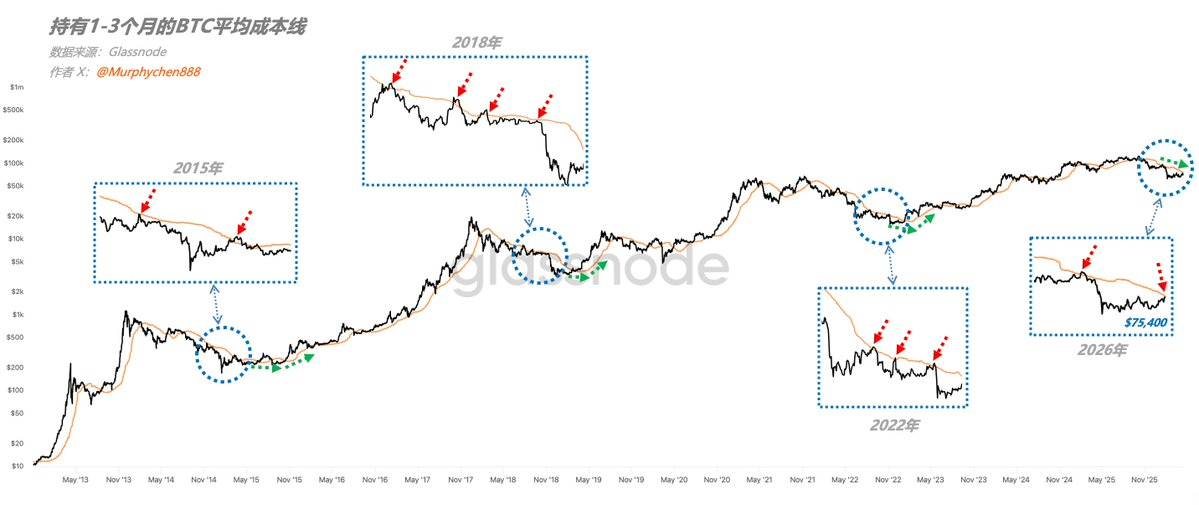
Based on long-term data research experience, I believe that among many groups, the cost basis of short-term holders holding for 1-3 months (1-3m_RP) is the most effective reference (as shown by the yellow line in Figure 1).
From the chart, it can be seen that in all past bear market cycles, 1-3m_RP has been the key resistance level during the downtrend rebound. This is because the holders of 1-3 month chips are not very firm. A large portion of them did not intend to hold long when they entered.
They may have originally wanted to 'grab a quick bite', but unexpectedly got trapped and were forced to hold for 1-3 months. When the price rebounds and gives an opportunity to break free, they will sell decisively.
Therefore, we see that in 2015, 2018, and 2022, every time BTC rebounded to the yellow line and encountered resistance, it would continue to pull back; rebound again, encounter resistance again, pull back again...
Of course, there have also been many false breakouts, indicating that when some chips start to profit, they 'run first as a courtesy', subsequently leading more chips to 'follow suit', thus forming a false breakout.
In the end, it is still a manifestation of investors' lack of confidence in the market.
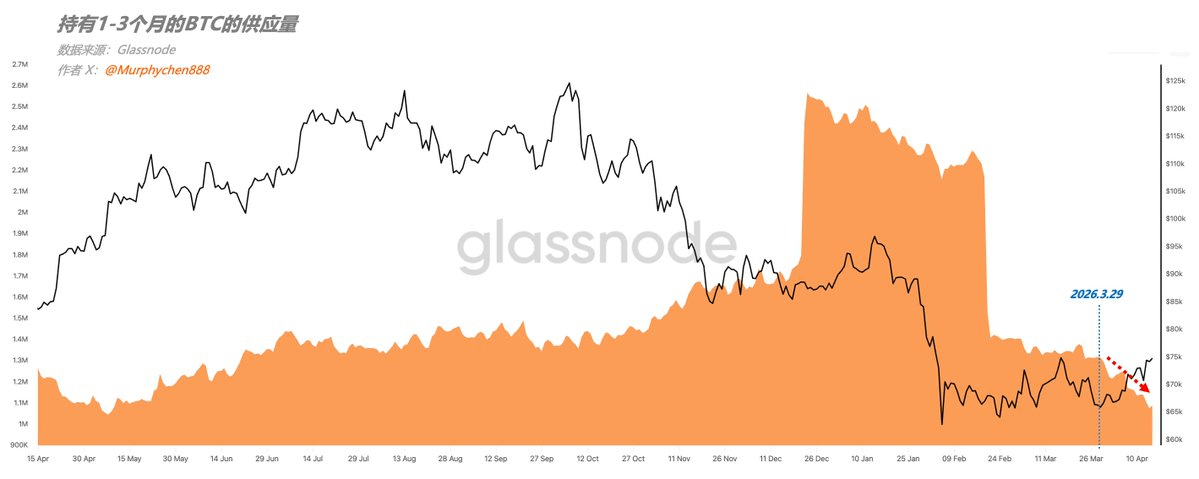
For example, looking at the changes in the supply of BTC held for 1-3 months in Figure 2, there has been a significant downward trend after March 29. This indicates that this portion of chips has decreased.
The decrease can occur for two reasons: 1. Due to continued holding, it is classified into a longer holding group. 2. Due to selling, it is classified into a shorter holding group.
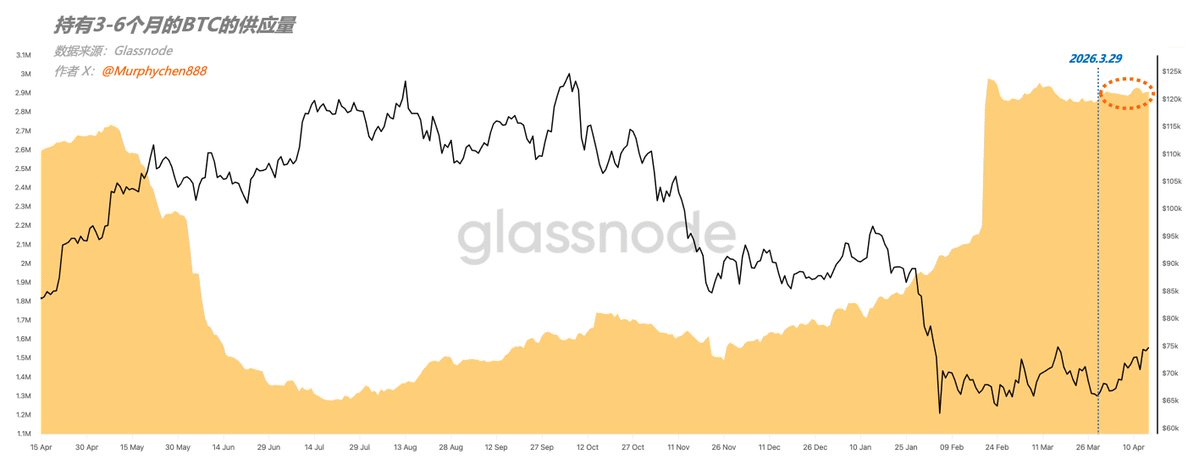
Looking at Figure 3, there has been no significant increase in the supply of BTC held for 3-6 months after March 29. This proves to be situation 2, where the 1-3 month BTC was sold during the rebound, and there are currently 1.09 million left.
🚩The logic has been explained, let's return to the current situation:
As of April 15, the 1-3m_RP is approximately $75,400, and the price of BTC is also just around this level. This is the second rebound of BTC in this downward trend approaching that resistance level.
The last time was between January 13 and January 19; after a slight breakout, it triggered selling pressure and continued to pull back. So will it be the same this time?
From past data, I believe the likelihood is high; after all, in the past three cycles, there has never been a second challenge that successfully reversed.
Of course, from a rational perspective, we cannot make a 'path preset'. Objectively speaking, there is also a possibility that:
BTC could break through the yellow line, but afterwards, it will encounter a larger resistance level above, namely the STH-RP (average cost line of short-term holders), currently around $81,000, with 2.31 million BTC (far greater than the 1-3m chips).
If it encounters resistance here, then BTC may experience oscillation around the yellow line, meaning the market needs time to digest the selling pressure and begins to cautiously choose a direction.
As time goes by, the yellow line will gradually start to turn, similar to the position marked by the green dashed line in Figure 1. This means the market has emerged from a bottom structure and entered a 'bear-to-bull transition period'.
From a probabilistic standpoint, situation 1 (the second encounter with the yellow line) is more likely, but situation 2 (oscillating around the yellow line) is not entirely impossible. Therefore, we need to patiently observe; even temporary breakouts should be assessed for their authenticity.
In any case, the current direction of the yellow line is still downward, and it cannot suddenly turn upward. This requires a relatively long transition process, and this process is the best time for us to make decisions.