We learned about candlesticks 🕯️, patterns 🔄, and trends 📈
Now it's time to understand:
Technical Patterns
Not one or two candlesticks...
👉 A full shape on the chart tells the market's story 💡
🔴 First: Reversal Patterns (Trend Change)
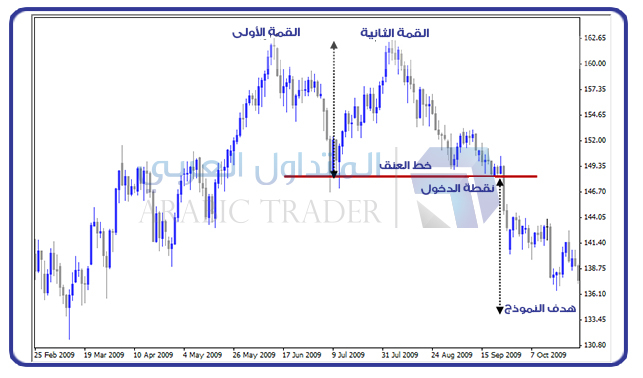
1️⃣ Double Top
Shape:
Price reaches the same peak twice
Meaning:
👉 Market failed to rise
👉 Sellers took control
📉 Potential drop
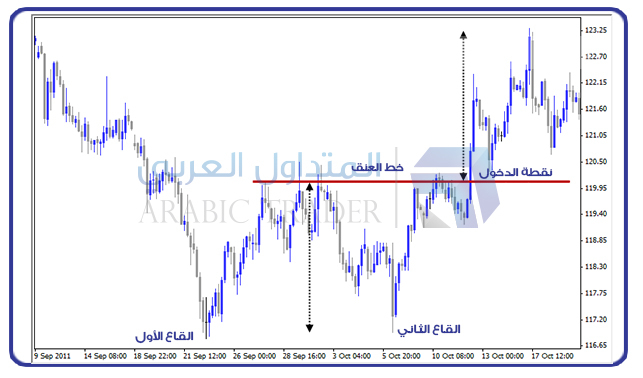
2️⃣ Double Bottom
Shape:
Price hits the same bottom twice
Meaning:
👉 Market failed to drop
👉 Buyers have entered
📈 Potential rise
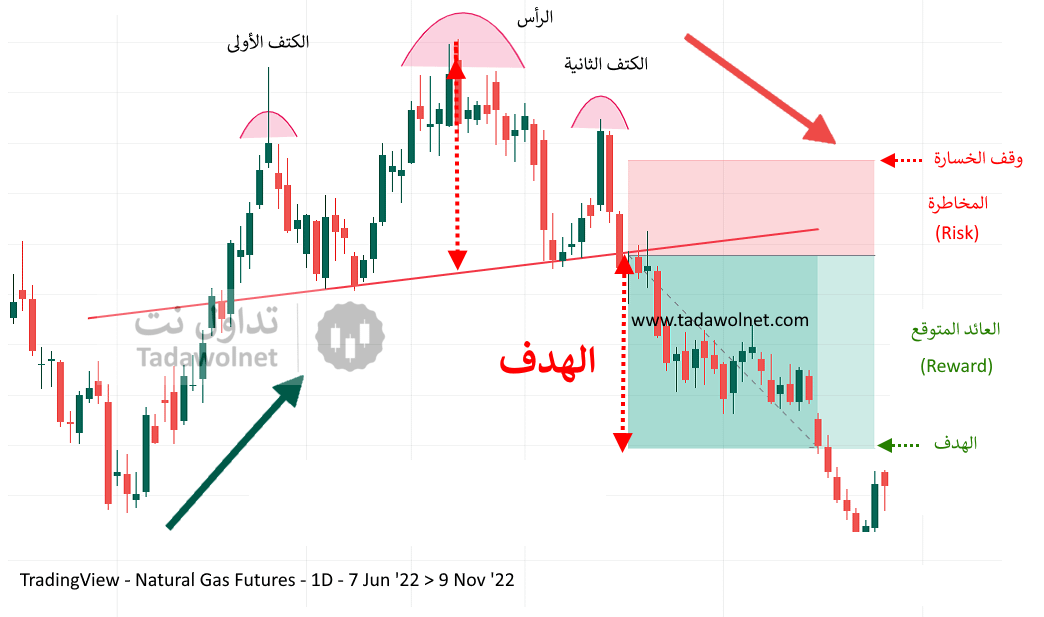
3️⃣ Head & Shoulders
Shape:
Peak
Higher Peak (the Head)
Peak
Meaning:
👉 Weakness in rising
👉 Potential reversal to down ⛔
🟢 Secondly: Continuation Patterns (Trend Continuation)
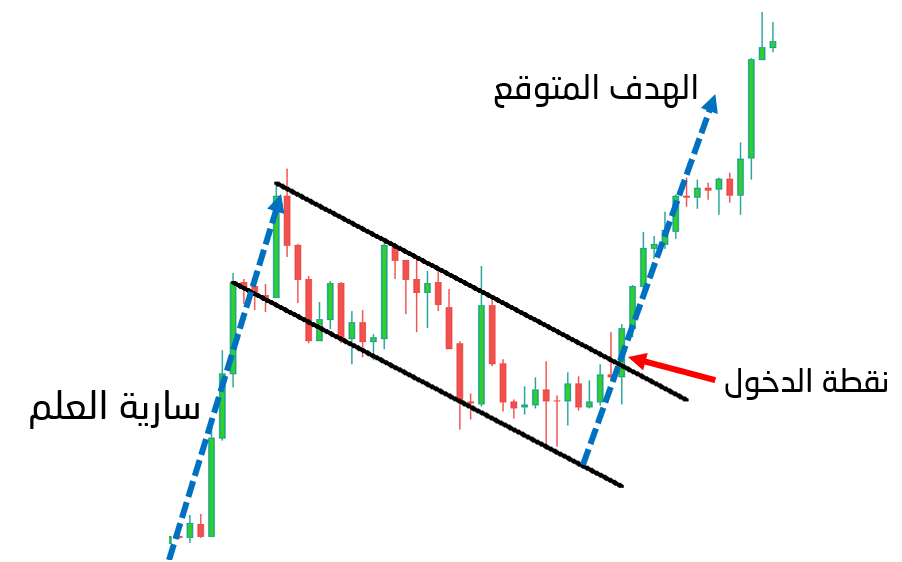
🚩 1️⃣ Flag Pattern
📈 Bull Flag
Strong rise 🚀
Then a slight drop (Correction)
👉 Break → Then continuation upwards
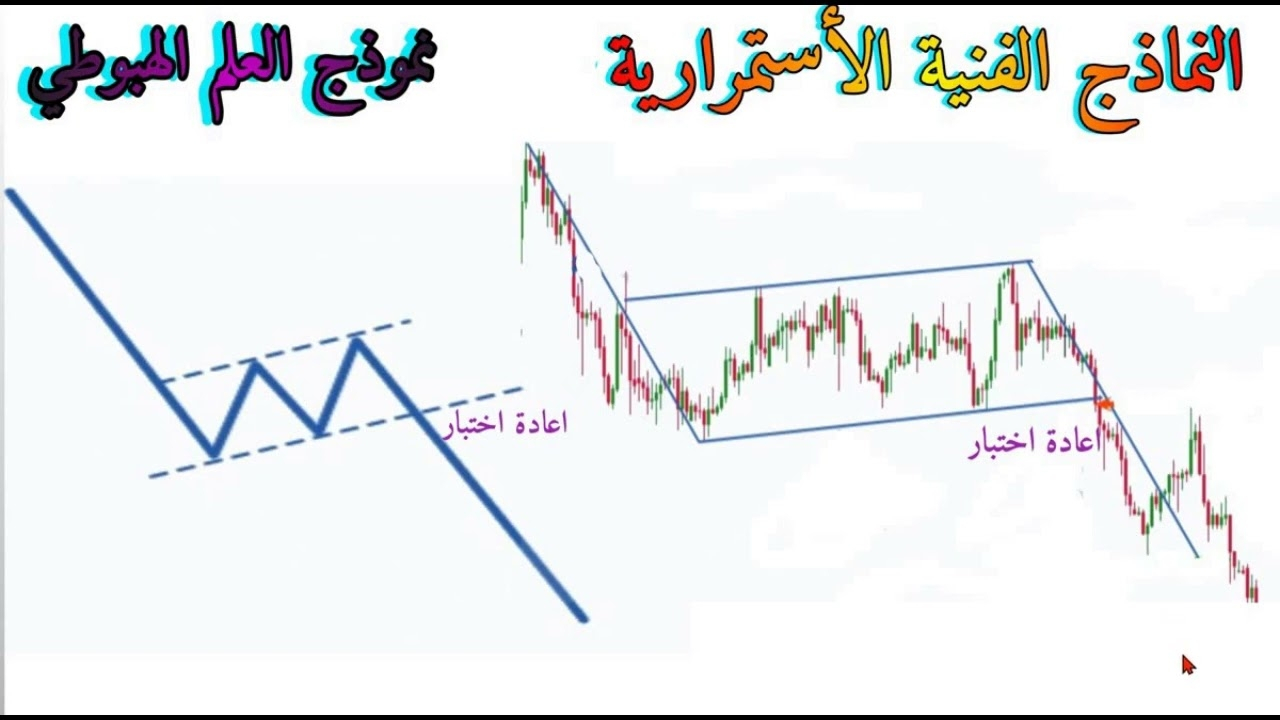
📉 Bear Flag
Forms when the trend is downward
Strong drop ⛔
Then a slight rise
👉 Break → Then continuation down
🔺 2️⃣ Triangle Pattern
💡 The idea:
Price is tightening... the market is gearing up for a strong move
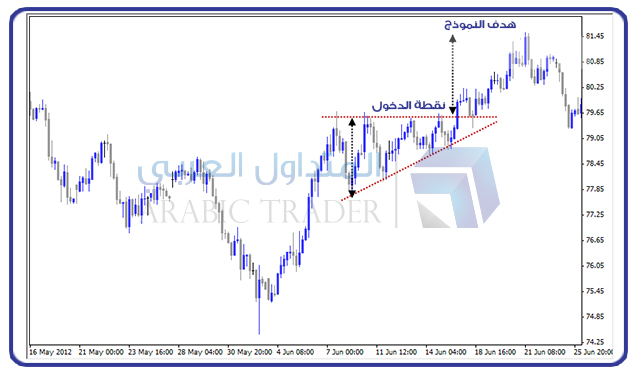
📈 Ascending Triangle
Fixed Peaks
Ascending bottoms
👉 Buying pressure
👉 Likely to break upwards 🚀
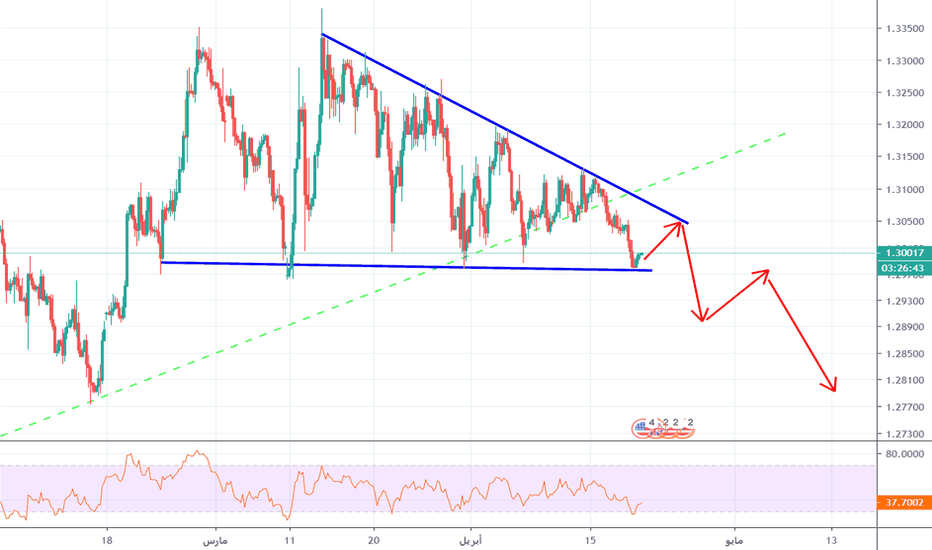
📉 Descending Triangle
Descending peaks
Fixed bottoms
👉 Selling pressure
👉 Likely to break downwards
⚠️ Most important rule
❗ Don't enter before the breakout
👉 The pattern without a breakout = just a shape
🧠 How do you connect this with what you've learned?
Uptrend + Bull Flag → Continuation 🚀
Uptrend + Double Top → Reversal ⛔
Triangle at the bottom → Potential rise
Triangle at the peak → Potential drop
💣 Beginner mistakes
Sees any shape and calls it a pattern ❌
Entering before the breakout ❌
Ignoring the trend ❌
Most important thing:
👉 Trend + Location + Breakout
🔥 In the next article:
We're going to dive into support and resistance
