Traders use dozens of indicators to determine optimal entry and exit levels from positions and to forecast the price dynamics of assets. However, one of the most universal remains the Fibonacci circles — they help identify potential support and resistance zones, as well as price consolidation. Nevertheless, despite the apparent simplicity, its application requires a deep understanding of the market and the ability to combine different methods of technical analysis.
What are Fibonacci circles and their role for a trader
Fibonacci circles are a graphical tool for technical analysis, which appears on the chart as a series of arcs based on the coefficients of the Fibonacci sequence. On trading platforms, it is available under the name Fibonacci Arcs or Fibonacci Circles.
The method involves connecting two key points — the minimum (swing low) and maximum (swing high) to define the range on which arcs are built with radii corresponding to the values of the sequence. On the chart, they appear as concentric arcs, each indicating a potential support or resistance zone.
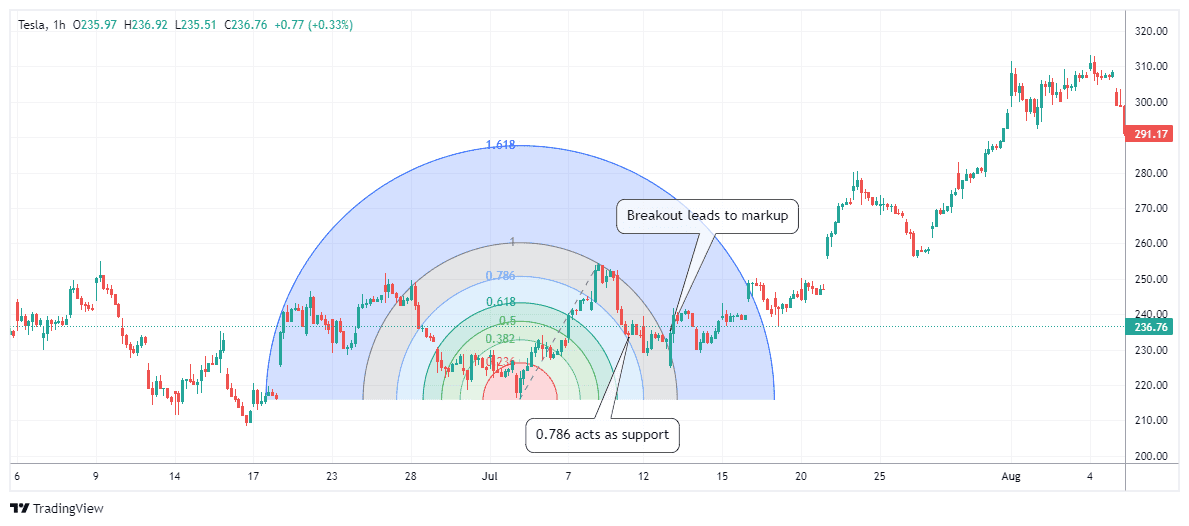 An example of using Fibonacci circles to determine key price levels. Data: TradingView.
The main difference between circles and Fibonacci levels is the consideration of dynamics. The arcs expand not only across the price scale but also along the time scale, showing how key price points shift as the trend develops. The main functions of this tool include:
visualization of consolidation zones and potential reversal points;
forecasting possible breakouts or trend resumption;
defining dynamic support and resistance levels;
increasing the accuracy of analysis based on market volumes.
All these opportunities make the tool especially useful when analyzing quotes during sideways movement. For example, after a strong rise in Bitcoin or altcoins, the price often enters an accumulation phase — oscillating sideways between the arcs of 38.2% and 61.8%. Fibonacci circles allow assessing not only the current range but also the potential moment of exit from it.
In the conditions of 2025, when the influence of institutional players has increased and consolidation periods have become longer, circles help to more accurately define price balance zones and predict exits from them.
Setting up Fibonacci circles for low-liquidity markets
Most altcoins have relatively low capitalization and market liquidity, so even minor trades can cause significant price movements where standard support and resistance levels cease to work.
In such conditions, Fibonacci circles help track patterns and determine where the price stabilizes before a new impulse. The main thing is to correctly choose the starting points and set up the tool's display.
The first step is to establish the range on which the arcs will be built. It is formed between swing low (minimum, 0%) and swing high (maximum, 100%).
For an upward movement, the line is drawn from bottom to top — from minimum to maximum. For a downward trend — the opposite. For example, if an altcoin rises from $0.10 to $0.15 in a week, then $0.10 is swing low, and $0.15 is swing high. This range will become the basis for calculating all subsequent levels.
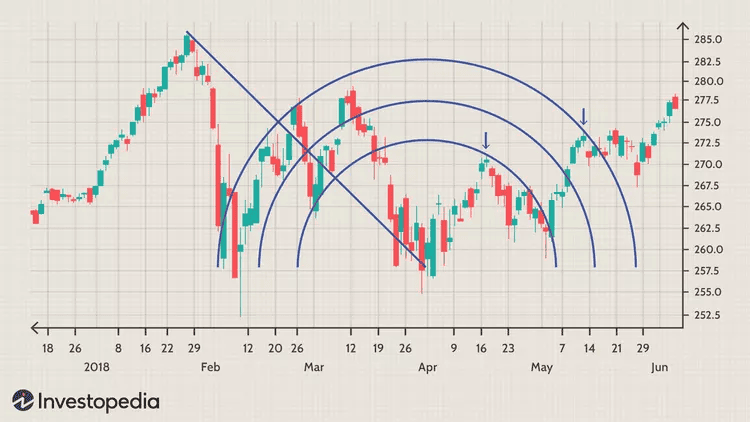 An example of defining the range for building Fibonacci circles. Data: Investopedia.
On platforms like TradingView, as well as in terminals #Binance and Bybit, Fibonacci circles are available in the graphical analysis section.
After selecting the tool, click on swing low, extend the line to swing high — and the system will automatically build the base axis with arcs. This line sets the structure for future analysis, displaying areas where the price may meet resistance or receive support.
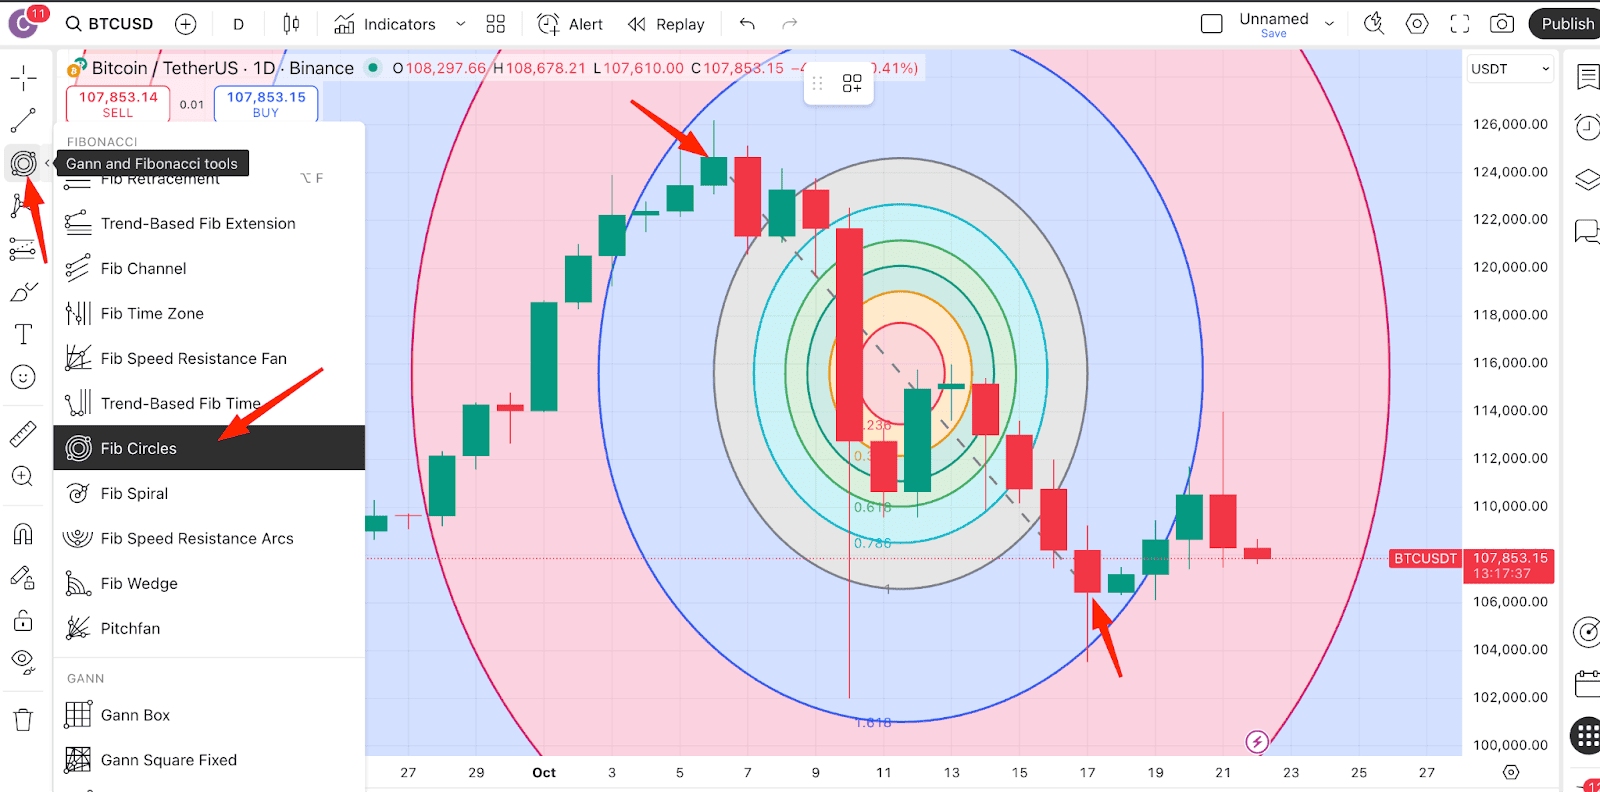 An example of building Fibonacci circles on the TradingView platform. Data: Incrypted.
The radius of the arcs determines how far they diverge from the baseline. For most scenarios, standard coefficients are sufficient: 23.6%, 38.2%, 50%, 61.8%, 78.6%, as well as extensions of 161.8% and 261.8% — for targets beyond the range.
On low-liquidity assets, an excessive number of lines creates visual noise, so it is better to limit to three or four arcs. Optimal timeframes are H4 or D1, as consolidations last from five to ten days, forming stable price levels.
Trading strategies with Fibonacci circles
Fibonacci circles are most often applied during periods when the market transitions into sideways movement and gains momentum before a new trend. At such moments, classic tools — levels and trend lines — lose effectiveness.
However, to make the analysis more accurate, the tool should be combined with Volume Profile and oscillators like RSI or MACD. If increased trading volumes are observed near the arc, this is a sign of confrontation between buyers and sellers — that is, the level is significant, not random.
Based on combined data, traders can use several strategies for entering and exiting positions.
Rebound from the arc
The simplest and most popular methodology. It is based on the fact that during consolidation, the price moves in 'waves' between the nearest arcs. For example, when the asset approaches the lower arc (for example, 38.2%), support often triggers — buyers perceive this level as a point for entry.
The overall logic is as follows:
if the price approaches the lower arc, and RSI remains above 50, it is worth looking for a point to enter a long position;
stop-loss is placed just below the arc;
take-profit — at the next arc, where the dynamics usually weaken.
The same principle applies to the scenario with the upper arc (for example, 61.8%), only in reverse — the price often goes down when sellers take profits or open shorts.
Breakout of consolidation
When the price is 'squeezed' between arcs for a long time, order pressure increases, so breaking one of the boundaries is a signal of a trend change. For example:
if the asset breaks above the upper arc (say, 61.8%), it indicates that buyers are taking the initiative.
a long position can be opened after confirmation through an increase in volume.
the target can be at the extended level of 161.8%, where the movement usually slows down.
To filter out false signals, it is recommended to use Fibonacci time zones. If a breakout coincides with the corresponding time interval, the likelihood of trend continuation increases.
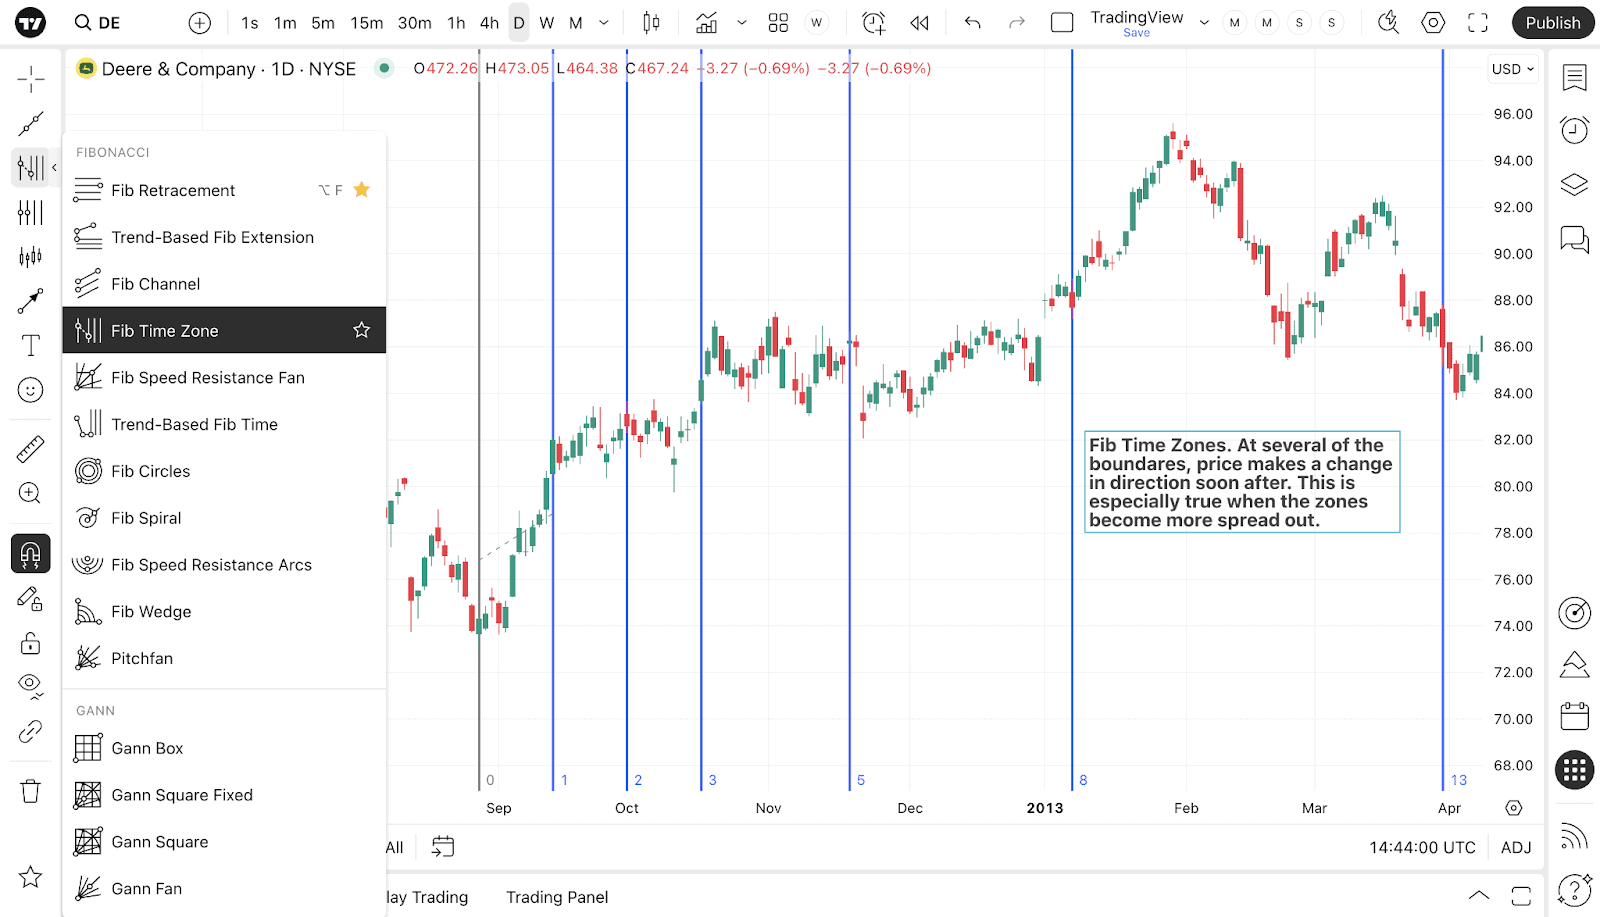 An example of displaying Fibonacci time zones. Data: TradingView.
Fibonacci circles do not provide trading signals by themselves, but they enhance the accuracy of analysis when used together with volume, time projections, and basic indicators of market dynamics.
However, it should be noted that due to the simplified perception of this tool, many traders make mistakes in its use and obtain inaccurate results. For example, if the baseline is not drawn through significant swing high and swing low, the structure shifts, and the zones lose their meaning.
Another common problem is an overloaded chart: the more arcs, the less clarity. For low-liquidity assets, a few key levels are sufficient to maintain a balance between detail and readability.
It's also important to remember that circles do not work well in strong trend conditions. When the price moves in a direction, the tool loses analytical value — the market does not oscillate but moves towards a target. Fibonacci circles should only be used during sideways movement periods when the asset is in an accumulation phase and preparing for the next impulse.
Practical application: examples of trades
To assess how Fibonacci circles work in the real market, let's consider an example of a trade using the 'rebound from the arc' strategy in the consolidation phase.
platform: Binance (spot market);
entry date: May 6, 2025;
entry price: $93,709;
exit date: May 8, 2025;
exit price/take profit: $103,000 (+9.9%);
stop-loss: $91,000 (−2.8%);
risk-to-reward ratio (R/R): 3.53.
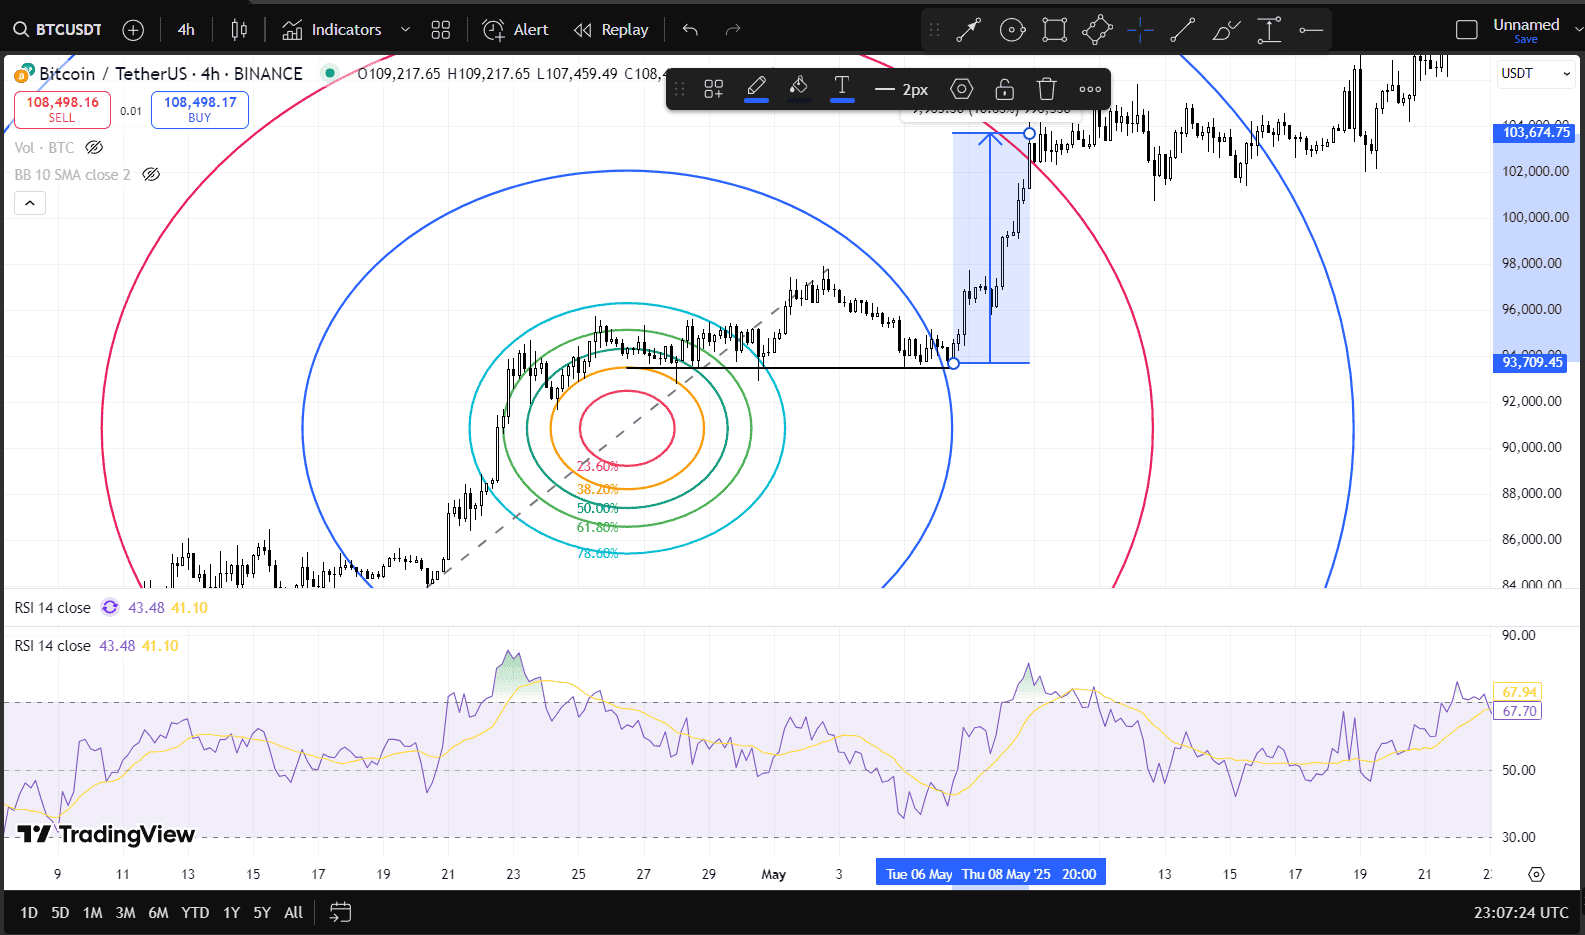 An example of using Fibonacci circles in a trading strategy. Data: TradingView.
In this case, the price of Bitcoin corrected after the rise and approached the 38.2% arc, which in this structure acted as a support zone. Upon reaching it, the asset reacted with a rebound, which is generally typical in a consolidation phase when the market 'cools down' after an impulse. Additional data were also considered:
RSI was at 37, indicating oversold conditions but not a trend change;
the volumes in the rebound zone were reduced, signaling a weakening of selling pressure.
The combination of these factors — touching the 38.2% arc, low RSI, and weakening sales — gave the signal to open a long position. The exit was realized at the level of $103,000, resulting in a profit of almost 10% with a risk of less than 3%.
To evaluate the effectiveness of such trades, it is essential to maintain a trader's journal. It can be organized in Excel or using specialized applications. In each case, it is worth recording:
the date and time of opening and closing the position;
entry and exit prices;
the rationale for the decision (for example, rebound from the 38.2% arc + RSI 37);
the indicators used;
the risk-to-reward ratio;
emotions and observations.
Subsequent analysis of the journal allows identifying patterns — understanding which patterns work better and where the strategy requires adjustments.
In this example, the combination of a rebound from the arc and oversold signals showed that Fibonacci circles can not only outline consolidation zones but also potential entry points with forecasted risk.
Conclusions
Fibonacci circles allow a new perspective on market structure. Unlike classic levels, they reflect not only price ranges but also time ranges, helping to determine when and where a balance between buyers and sellers is formed. For a trader, this is a tool for observing consolidation phases — moments when the market is preparing for a new movement and it is important to see where exactly the impulse is born.
In the crypto market, Fibonacci circles are especially useful during periods of uncertainty. They show where the price may slow down, accumulate volumes, and change direction. In combination with RSI, volume analysis, and risk management, this tool can become an integral part of the strategy, allowing for reasoned actions even when the market lacks a clear trend.
#Traiding #трейдингдляпочатківців #Write2Earn
