As of April 21, 2026, Bitcoin (BTC) is showing signs of a localized trend reversal. After a turbulent second week of April, the price action suggests that the bulls are successfully defending critical mid-term support levels.
Bitcoin (BTC) Market Analysis
1. Price Action & Recovery
Current Price: Approximately $66,950.
Momentum: Bitcoin has put in three consecutive days of higher lows. The successful defense of the $63,000 psychological floor has shifted the short-term sentiment from "Fear" back toward "Neutral."
Volatility: While intraday swings remain high (averaging 3–4%), the "panic selling" observed on April 15 has largely subsided, replaced by steady accumulation.
2. Technical Outlook
Immediate Resistance: The $67,200 - $67,500 zone is the current hurdle. A daily close above this level would likely trigger a fast move toward the $70,000 psychological barrier.

Support Base: Strong structural support is now firmly established at $64,800. As long as BTC holds above this level, the "bull flag" pattern on the daily timeframe remains intact.
Volume Profile: Trading volume has stabilized. Interestingly, the most recent leg up (April 20–21) occurred on increasing volume, a bullish sign indicating that the move is backed by actual demand rather than just a short-squeeze.
3. Macro & Fundamental Drivers
Institutional Inflows: Spot ETF data for the last 48 hours shows a return to net positive inflows, suggesting that institutional players viewed the sub-$65k dip as a prime entry point.
Network Security: The hash rate continues to trend near all-time highs, ensuring the network's underlying security remains robust despite the price correction.
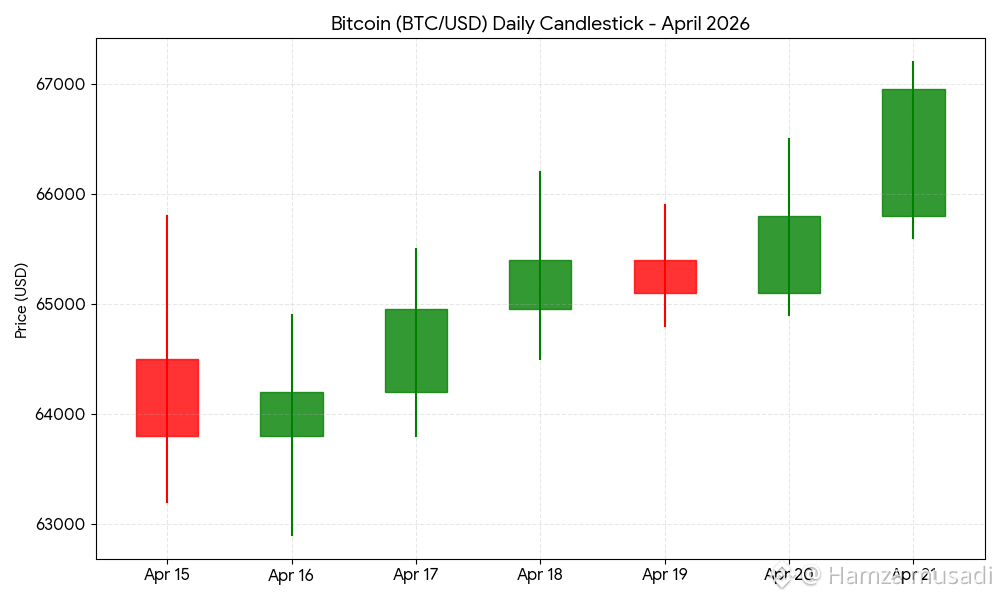
BTC/USD Daily Candlestick Chart (April 15 – April 21, 2026)
The chart below highlights the recovery arc following the mid-month correction. Note the strong green candle for April 21 as the price tests the upper resistance.
Summary:
Bitcoin is transitioning from a "correction" phase into a "recovery" phase. The technical structure is currently bullish-neutral. Traders should watch the $67,500 level closely; a breakout here could invalidate the recent bearish narrative and set the stage for a test of the yearly highs.