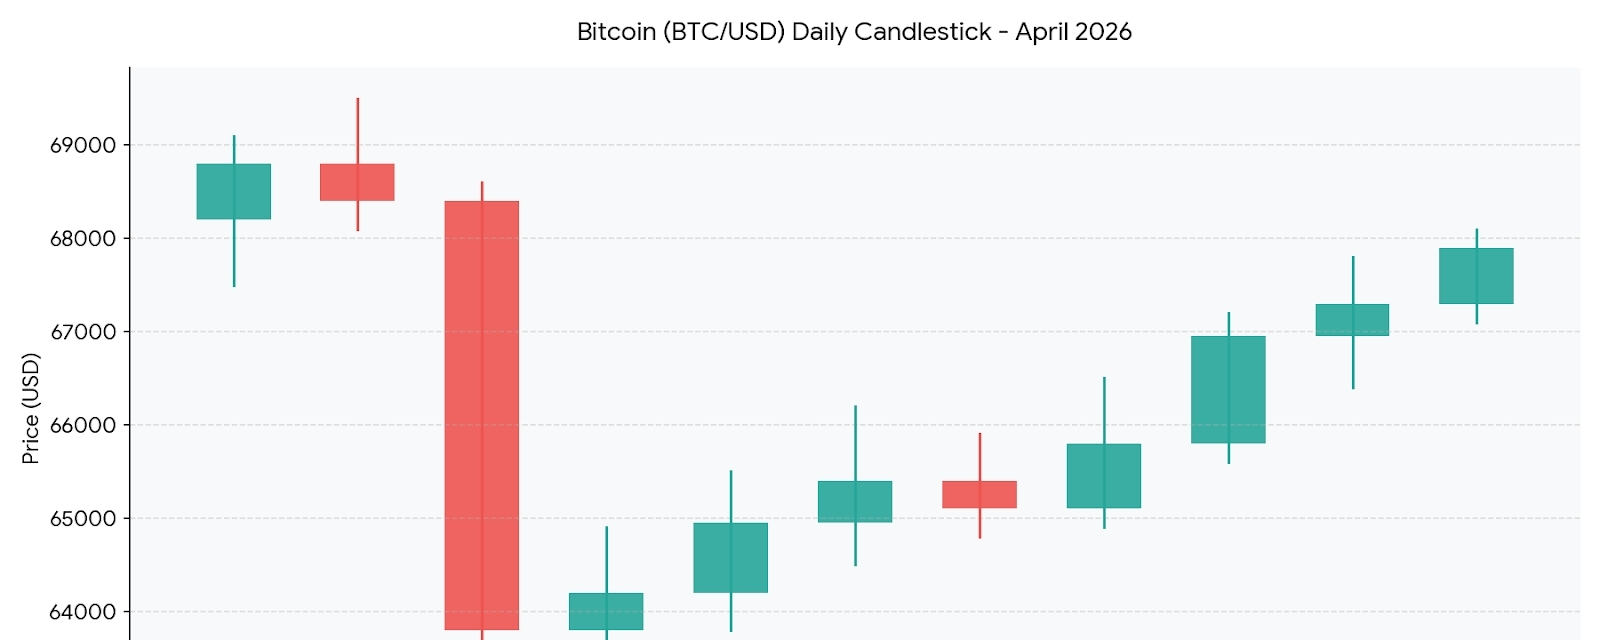
The chart below tracks Bitcoin's price action from the mid-April volatility through today, April 23, 2026.
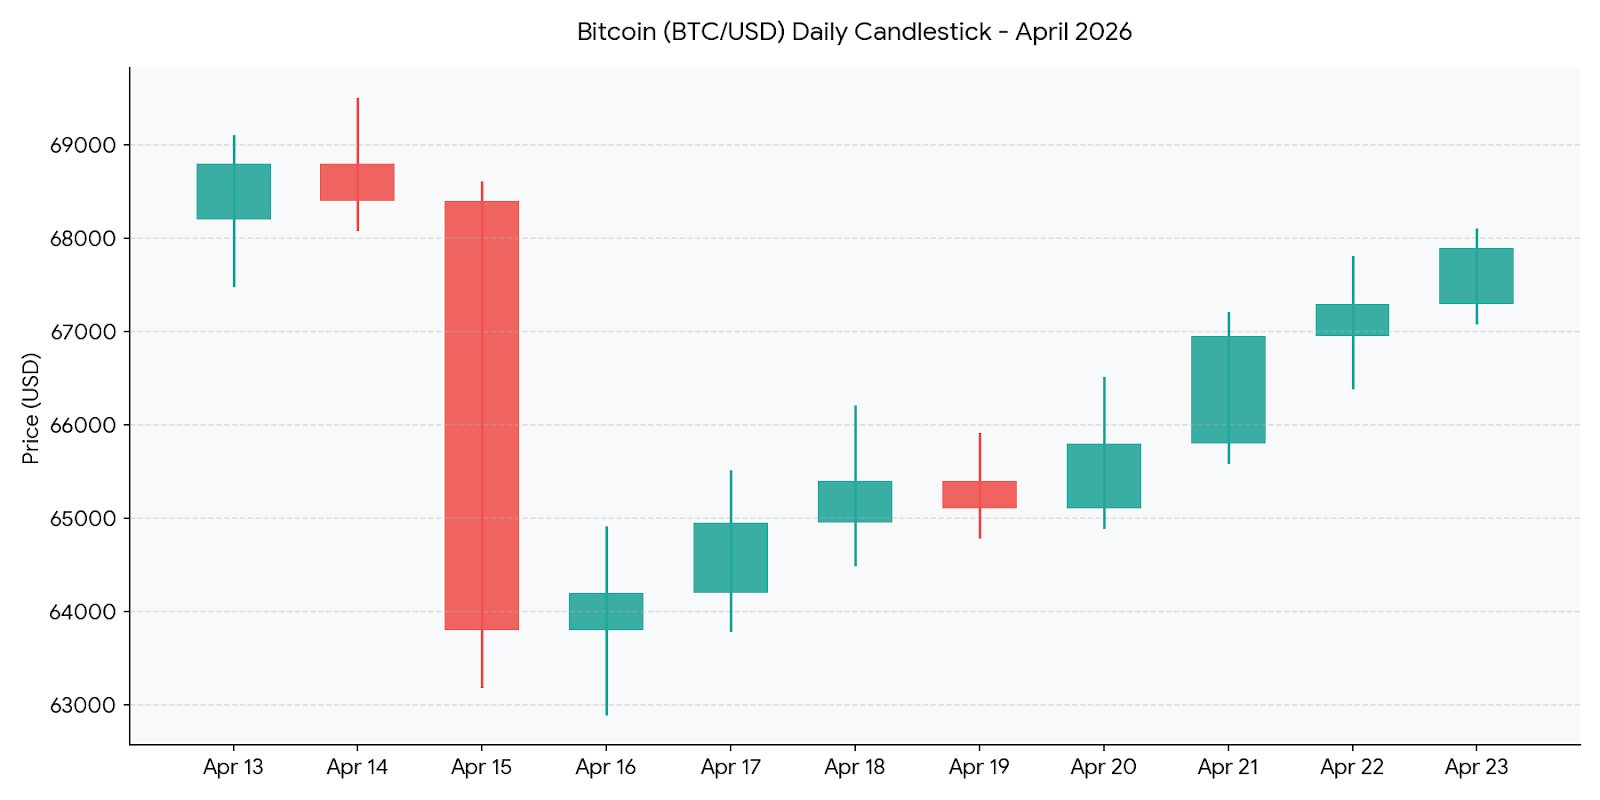
The most prominent feature is the "long-wick" flush on April 15, where BTC briefly dipped to $63,200 before aggressive buying stepped in. Since that capitulation event, the market has transitioned into a steady recovery phase, characterized by a series of "higher lows."
BTC/USD Technical Breakdown
The Flush (Apr 15): This 7.5% intraday drop cleared out high-leverage long positions. The rapid bounce-back confirmed strong institutional demand in the low $60k range.
The Recovery (Apr 16–21): BTC spent a week climbing back into the mid-$60k zone. Note how the "bodies" of the candles narrowed during the 18th and 19th, signaling a brief moment of indecision before the next leg up.
Current Range: As of today, Bitcoin is testing the $68,000 psychological resistance. A daily close above this level would likely signal a full recovery of the mid-month losses.
Key Trading Levels
Support: $65,800 (previous resistance now acting as a floor).
Resistance: $68,200 (the "breakout" level to watch for).
Volume Profile: While not shown on the chart, volume has been tapering during this move up — a common signal that the market is waiting for a major catalyst (like the upcoming FOMC minutes or ETF flow data) to decide the next direction.
#CHIPPricePump #KelpDAOExploitFreeze #JointEscapeHatchforAaveETHLenders #MarketRebound #BTC