1. Current price and market status
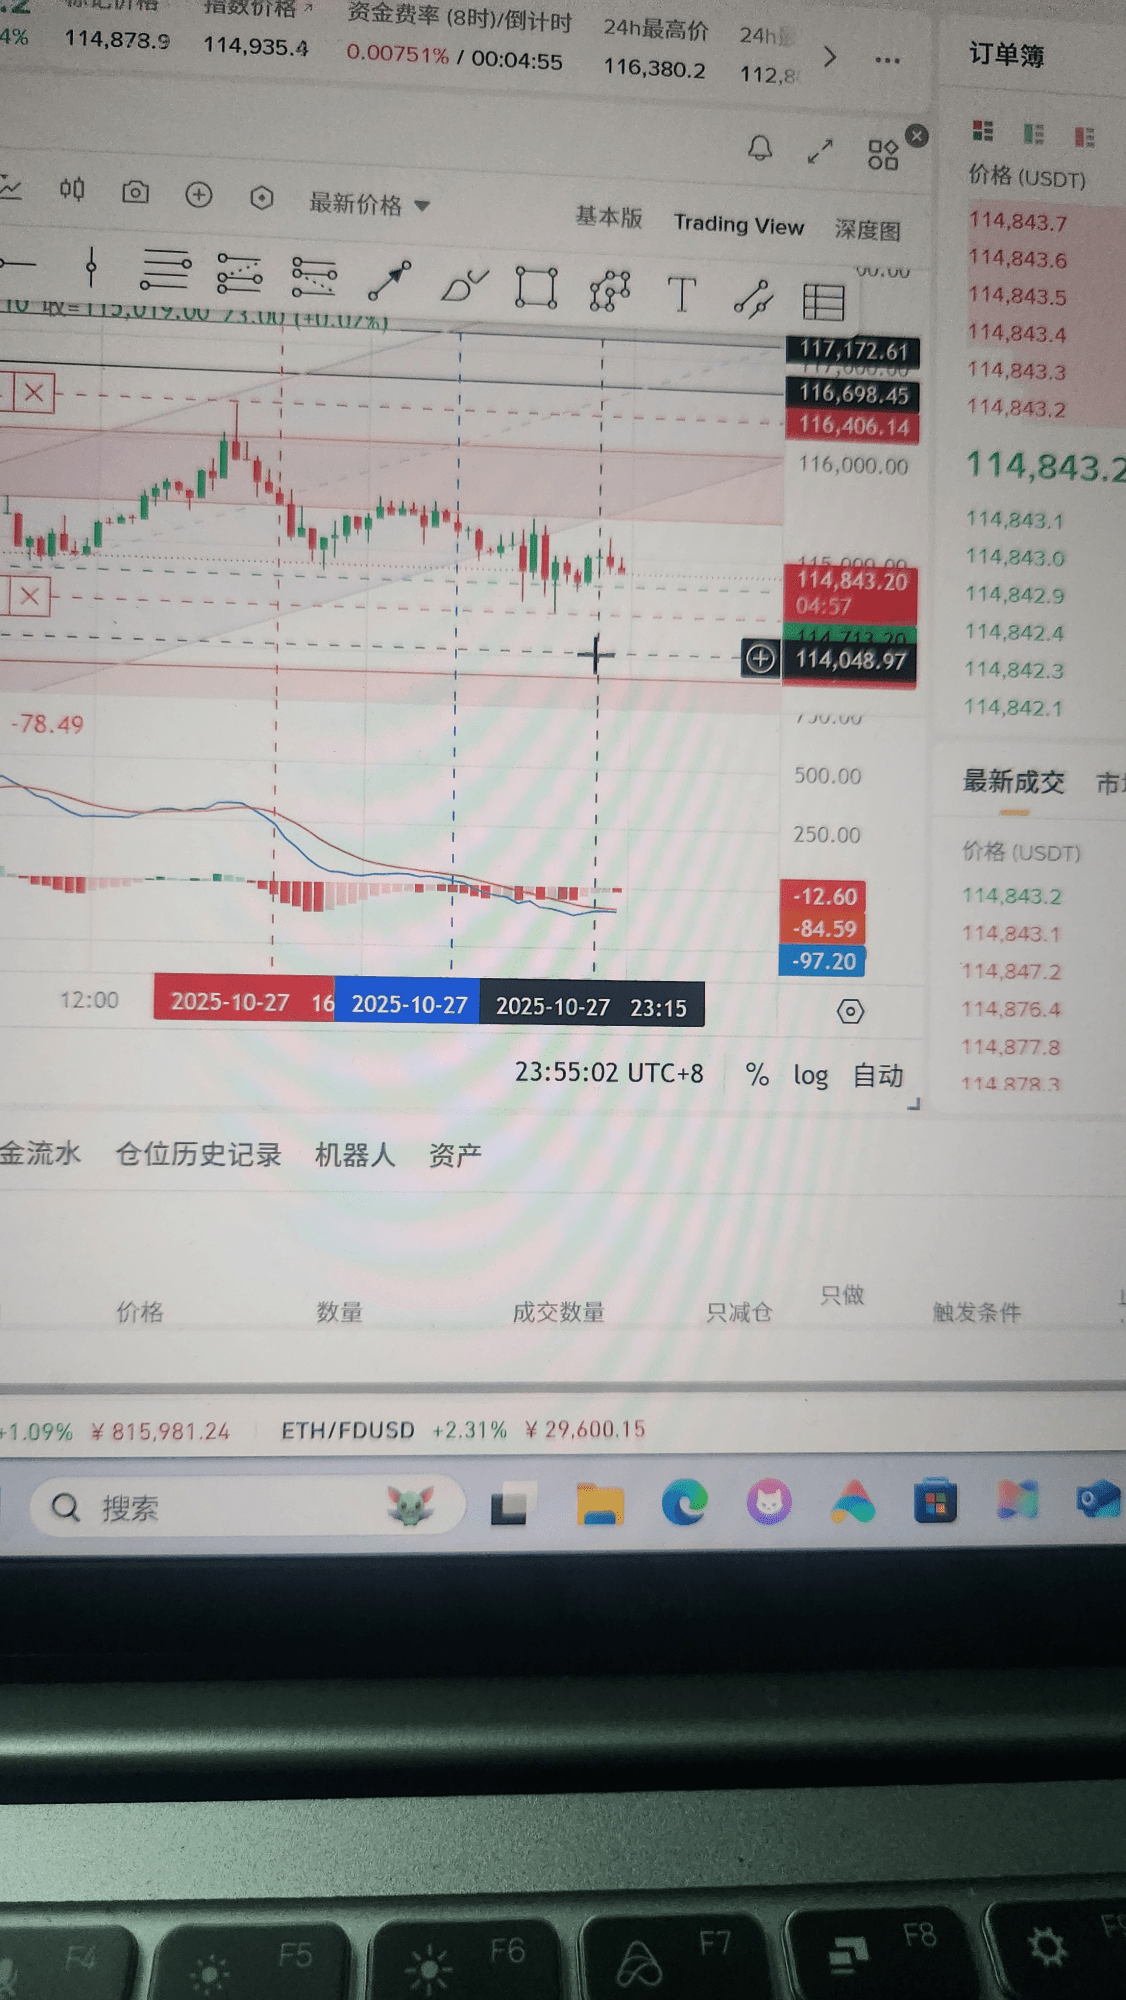
- Real-time price: According to data from the Binance platform, the price of the BTCUSDT perpetual contract is $114,823.30, up 1.18% from the previous day. Other platforms like Bitget show a price of $105,200.1, which may differ due to data delays or platform characteristics, with mainstream exchange data being the standard.
- Market sentiment: #内容挖矿升级
- Macro benefits: The expectation of interest rate cuts by the Federal Reserve is rising, benefiting liquidity-sensitive assets (such as cryptocurrencies).
- Whale movements: The '100% win rate whale' has increased its long positions during the pullback, with a total position value reaching $362 million, realizing a floating profit of over $16 million.
II. Technical Analysis#中美贸易谈判
1. Trend Direction:
- Short-term (4 hours): Price oscillates in the range of $112,901-$116,400, currently close to $114,823. The 4-hour candlestick shows a 'bullish engulfing' followed by a bearish line, indicating weakening short-term upward momentum.
- Medium-term (daily): Moving averages are in a bullish arrangement, the MACD histogram remains positive but shortens, indicating marginal decrease in bullish strength.
2. Key Support and Resistance Levels:
- Support Level: $113,500 (4-hour level Vegas Fast Track), $112,000 (previous low).
- Resistance Level: $115,000 (psychological barrier), $116,400 (24-hour high).
3. Technical Indicators:
- RSI: The 4-hour RSI is 37.62, in the oversold range, indicating short-term pullback pressure; the 1-hour RSI is 48.31, close to neutral level.
- MACD: The 4-hour MACD shows a top divergence (price makes a new high, but the indicator does not), suggesting a possible trend reversal.
- KDJ: The 4-hour KDJ value is 58, in the oscillation range, not giving clear signals.
4. Trading Volume and Open Interest:
- 24-hour trading volume: Approximately 500,000 BTC, shrinking compared to the previous day, forming a volume-price divergence, insufficient upward momentum.
- Open Contracts: 451,500 BTC (Ascendex platform), significant long-short divergence.
III. Multi-Cycle Divergence Analysis#加密市场反弹
4-hour period: Price reaches a recent high, but RSI and MACD do not synchronize, with significant top divergence signals, increasing the probability of a short-term pullback.
- 1-hour period: RSI and KDJ show no obvious divergence, trend continuity needs further observation.
- Operational Suggestions:
- Short-term traders: If the price falls below the support of $113,500, they can try shorting with light positions and a stop-loss at $114,000; if it breaks through the resistance of $115,000, they can chase long, targeting $116,400.
- Medium-term traders: Wait for multi-cycle divergence resonance or clear trends before entering, avoiding frequent operations in a volatile market.
IV. Risk Warning#美联储降息预期
1. Upside Risk:
- If the Federal Reserve's interest rate cuts are confirmed or institutional funds continue to flow in, prices may break through the resistance of $116,400 and start a new round of increases.
- Whales increasing positions may trigger a short squeeze, driving prices to rebound quickly.
2. Downside Risk:
- If it falls below the support of $112,000, it may drop to $110,000 (20-day moving average).
V. Strategy Summary#巨鲸动向
- Short-term (1-3 days): Bearish oscillation, focus on the breakout direction of the $113,500-$115,000 range, mainly high selling and low buying.
- Medium-term (1-2 weeks): If it stabilizes near $112,000 after a pullback, one can establish long positions at low prices, targeting $118,000.
- Long-term (more than 1 month): The expectation of interest rate cuts and institutional allocation needs support Bitcoin's long-term rise, but one should be wary of regulatory policy changes.$BTC
Note: The above analysis is based on public data. The market is highly volatile, and trading requires strict stop-loss.