

Brothers, good evening! As Bitcoin approaches the historic 80,000 mark, the market dynamics have taken a sudden turn! #BTC $BTC

The current price is defending a crucial retracement around 77,491. Putting aside all external emotional distractions, let's break down the true intentions of the whales behind this high-level resistance in the most hardcore trading language. With this battle report in hand, tonight's turning point is all right here!
🔥 Latest situation deep dive (hitting the whales' bottom line)
4-hour high pressure: Looking at the 4-hour chart, Bitcoin is facing a strong short attack after persistently pushing towards the 79,000 mark, leaving a long upper wick. The current price has retraced to around 77,491. Bullish momentum is showing clear signs of exhaustion here, and the massive profit-taking from earlier accumulation is being concentrated and distributed.
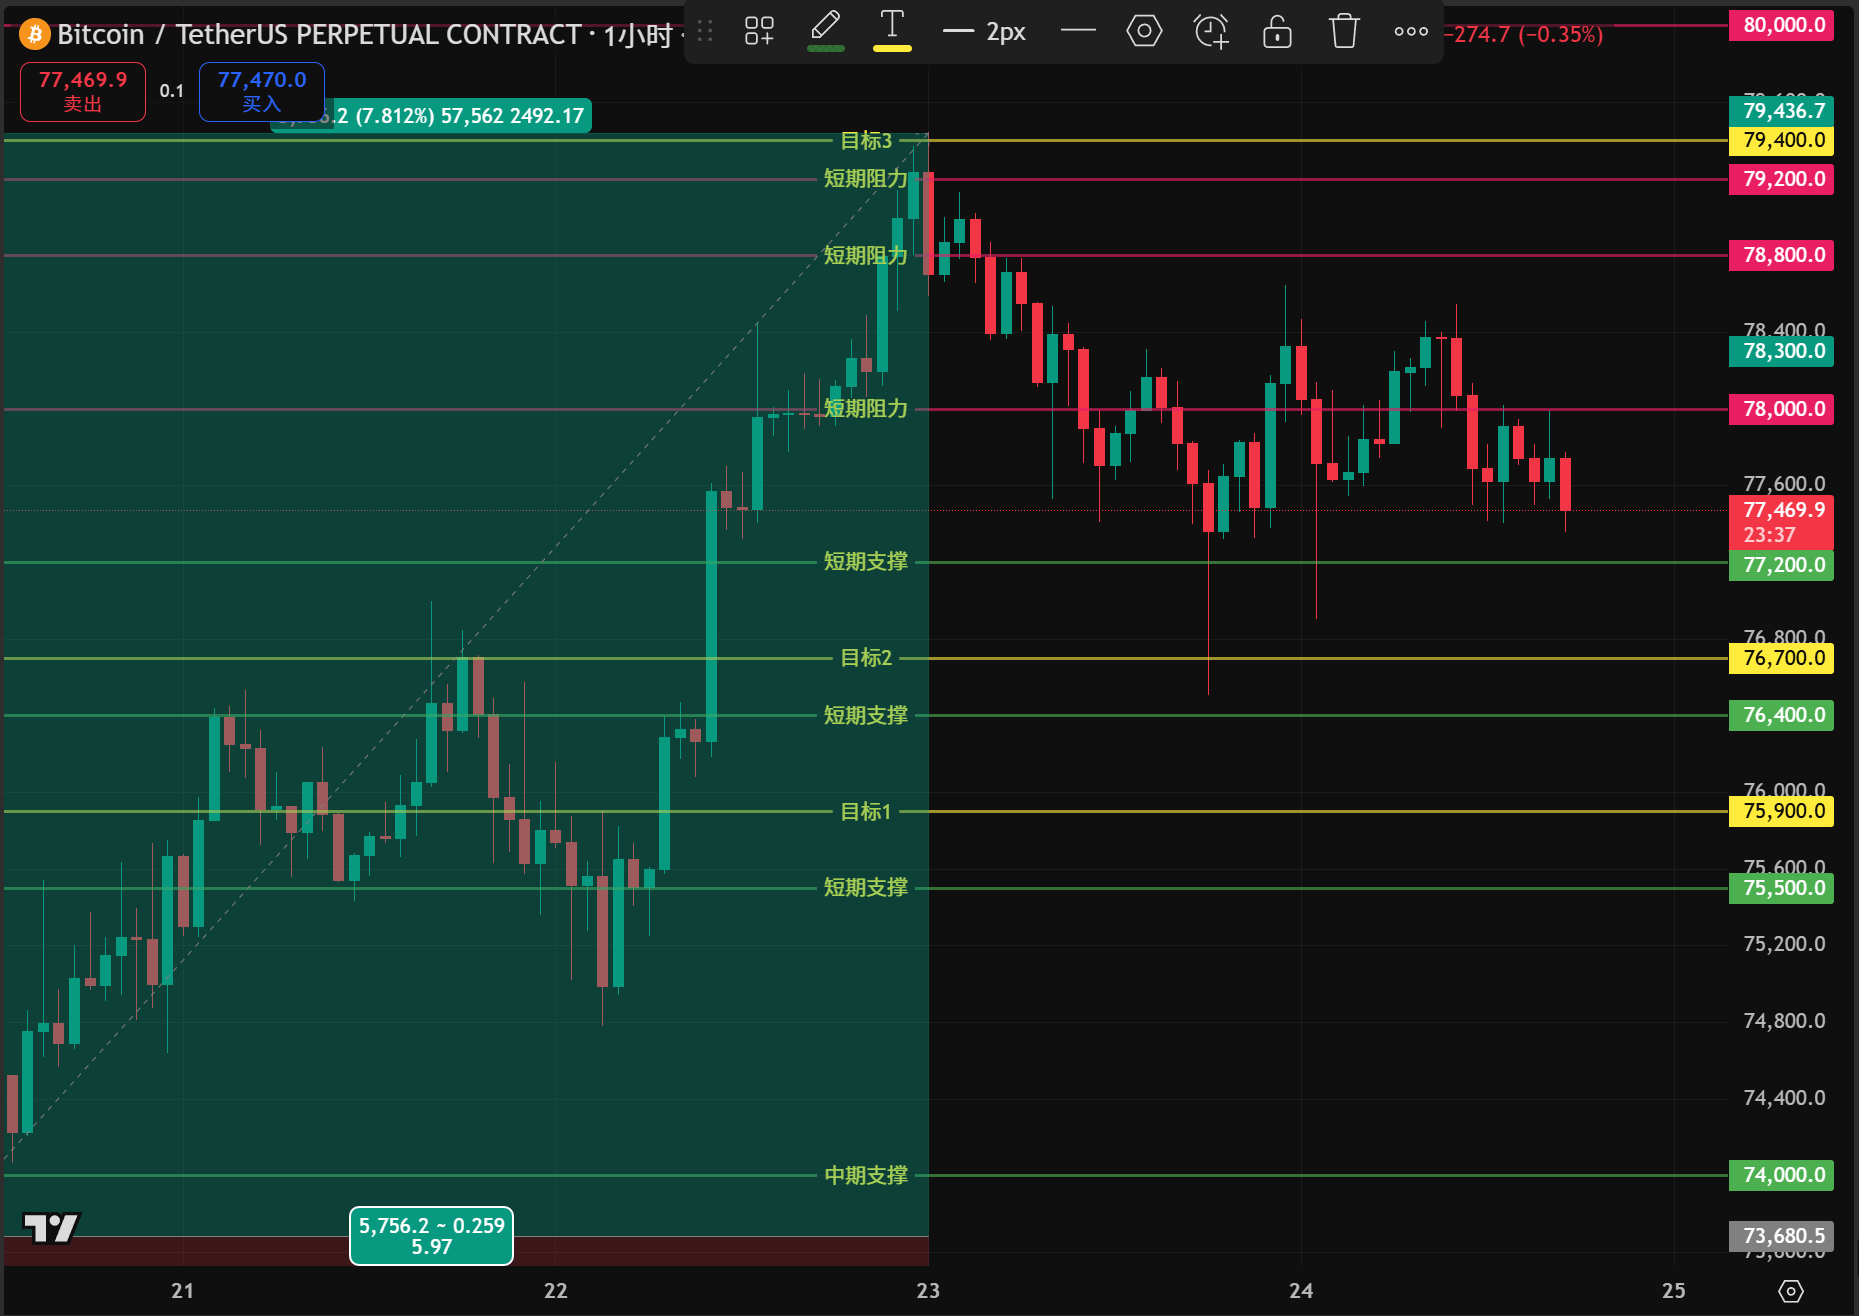
1-hour double top warning: Zoomed into the 1-hour level, the market has formed an extremely dangerous potential 'double top' structure (M head), with two failed attempts to breach 79,200 and 78,800, followed by a continuous downward trend. The current price of 77,491 is testing support near the neckline; if it breaks down with volume, a deeper short-term correction will begin.
Hold the line (fighting for the 126,000 big top): The ultimate high point in the macro bull market is around 126,000. As we approach the 80,000 threshold, it's extremely normal for the market to experience violent fluctuations of several thousand points. Avoid blindly chasing highs and lows at elevated levels; patiently wait for right-side structure confirmation!
1. Support and resistance levels (hardcore calculation version)
🟢 short-term support (1-3 days, intraday defense zone)
77,200: immediate support. A previous short-term pullback low on the 1-hour chart, serving as the initial defense line for the day.
76,400: strong support. A pause center in a recent upward movement on the 4-hour chart, with strong buying consensus.
75,500: core support. The upper edge of the previous wide-range consolidation box, a critical pivot for top-bottom conversion.
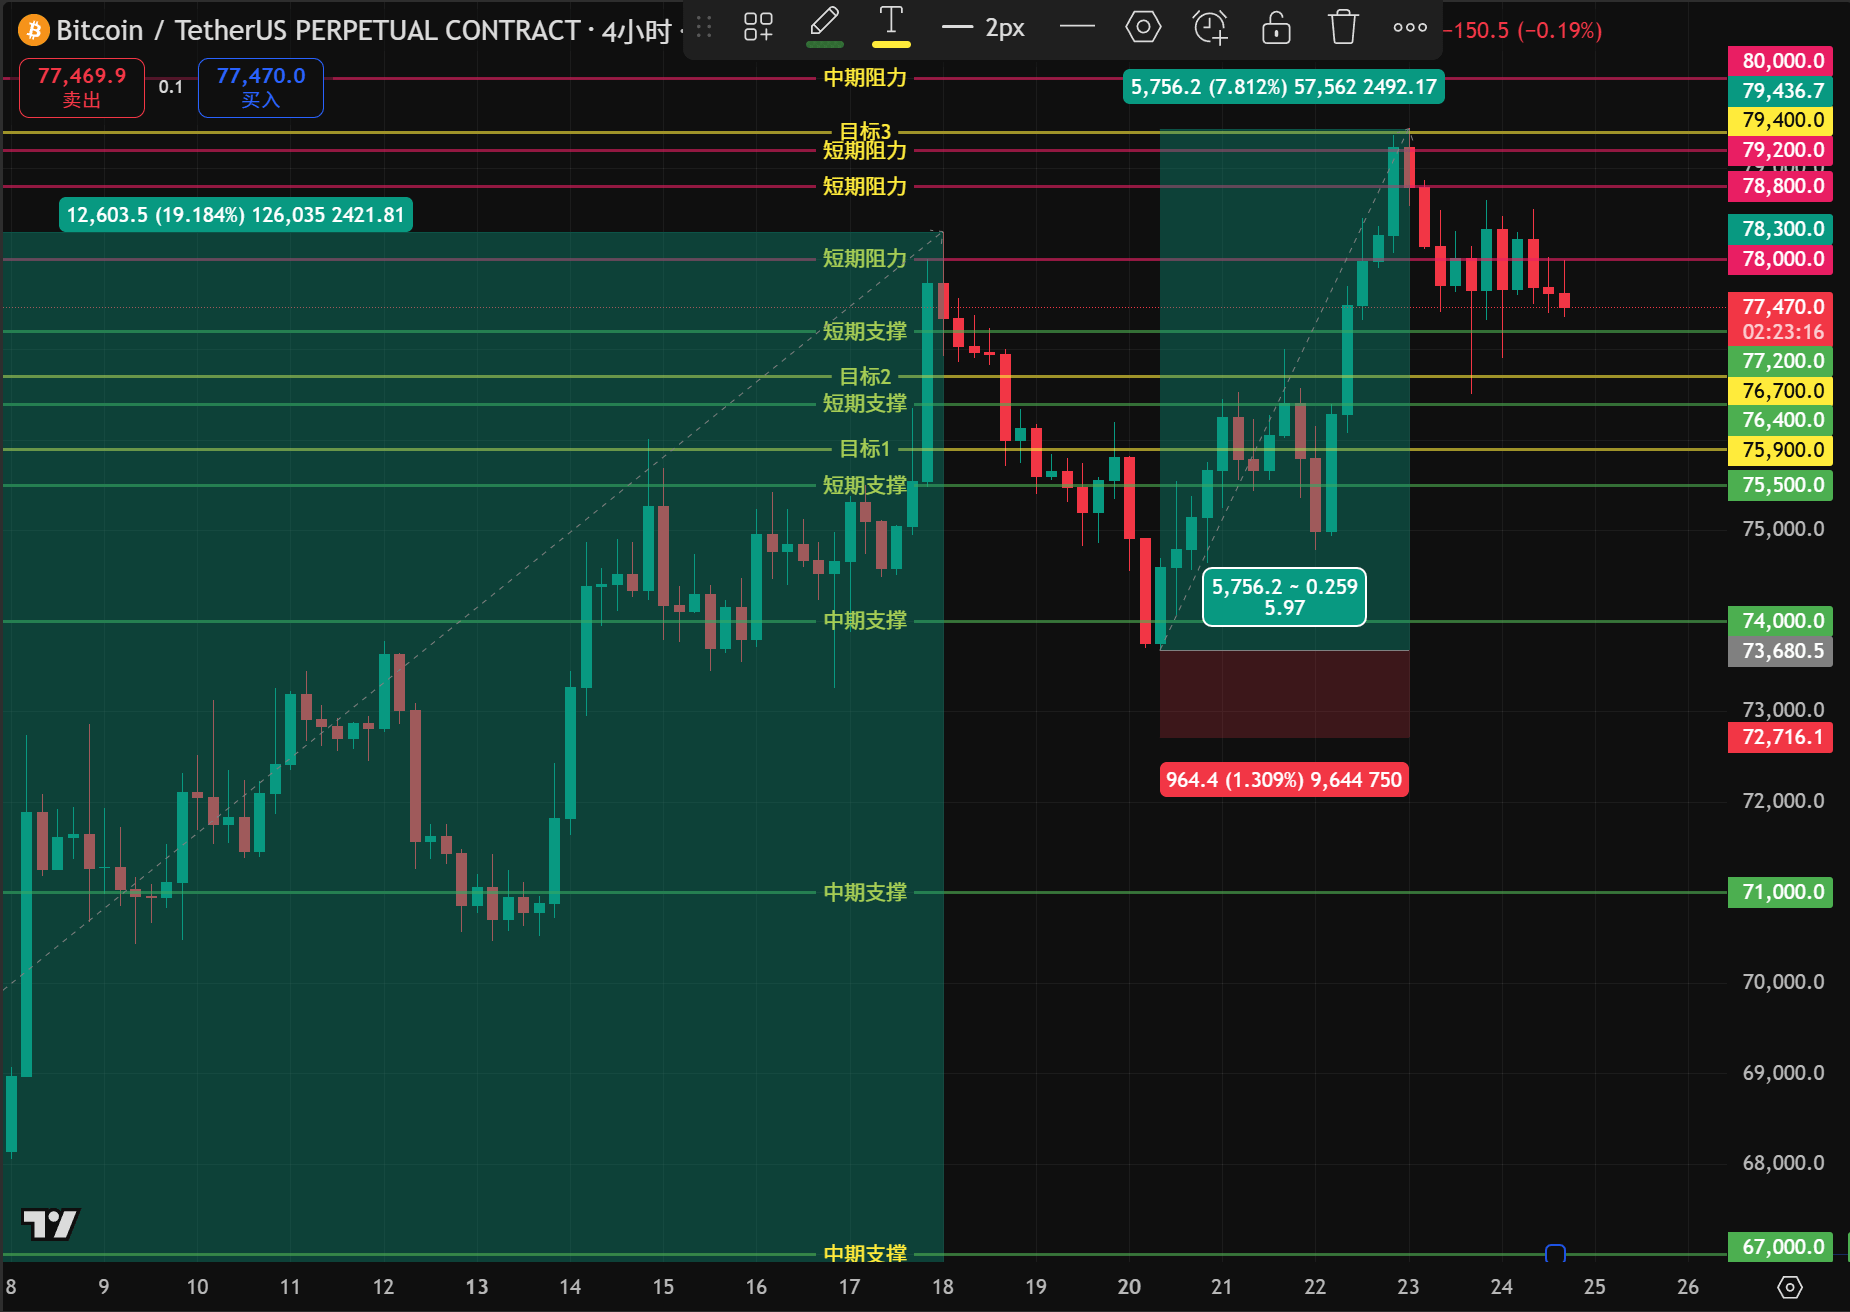
🔵 mid-term support (1-2 weeks, swing accumulation zone)
74,000: the lower edge of an important consolidation zone on the 4-hour level.
71,000: the launch pad for this round of main upward wave.
67,000: macro structural defensive bottom.
🔴 short-term resistance (1-3 days, pullback pressure zone)
78,000: immediate resistance. A pressure point during the downward process on the 1-hour chart, the first hurdle for short-term bulls to fight back.
78,800: strong resistance. The second high point on the 1-hour chart, with a dense accumulation of trapped orders.
79,200: core resistance. The absolute historical high reached in this round of upward attempts.
🟠 mid-term resistance (aiming for the 126,000 divine level)
80,000: epic psychological barrier.
84,000: the first macro expansion target in the second half of the bull market.
126,000: macro historical top (ultimate big BOSS).