1. Bitcoin Open Interest (OI) per Exchange
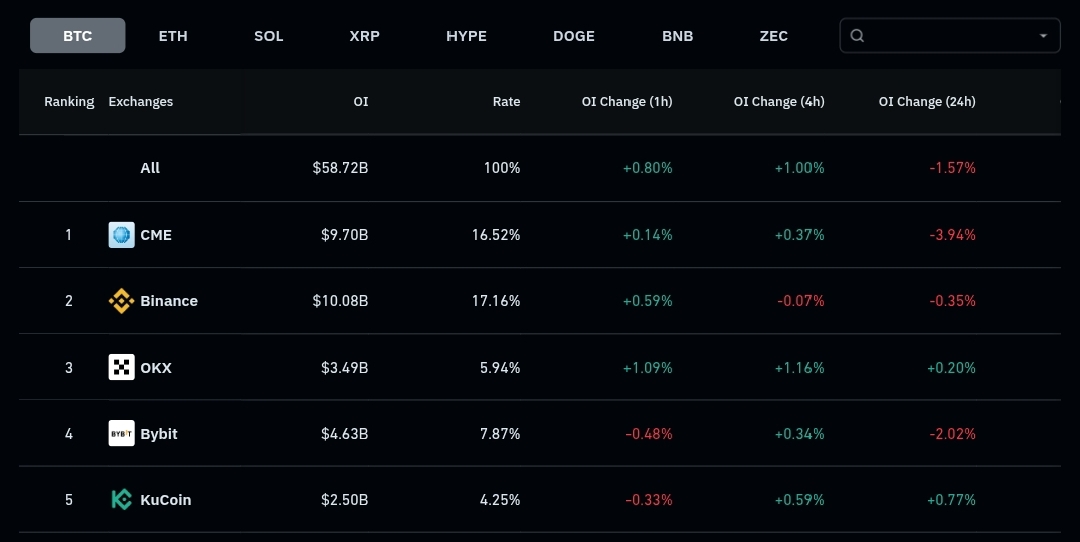
It's shows the total Bitcoin Open Interest (OI), which reached $58.72B. CME leads institutionally with $9.70B, followed by Binance in the retail market with $10.08B. The data shows an overall OI decrease of -1.57% in 24 hours, although there is a slight increase in the last 1-hour and 4-hour timeframes.
Impact:
The decrease in OI in the last 24 hours indicates position closing (both long and short) or mass liquidation. However, the slight increase in the lower timeframe (1-hour) indicates speculators are starting to re-enter the market. This indicates that volatility will remain high as the market seeks a new direction after the position "clearing."
2. Order Whales
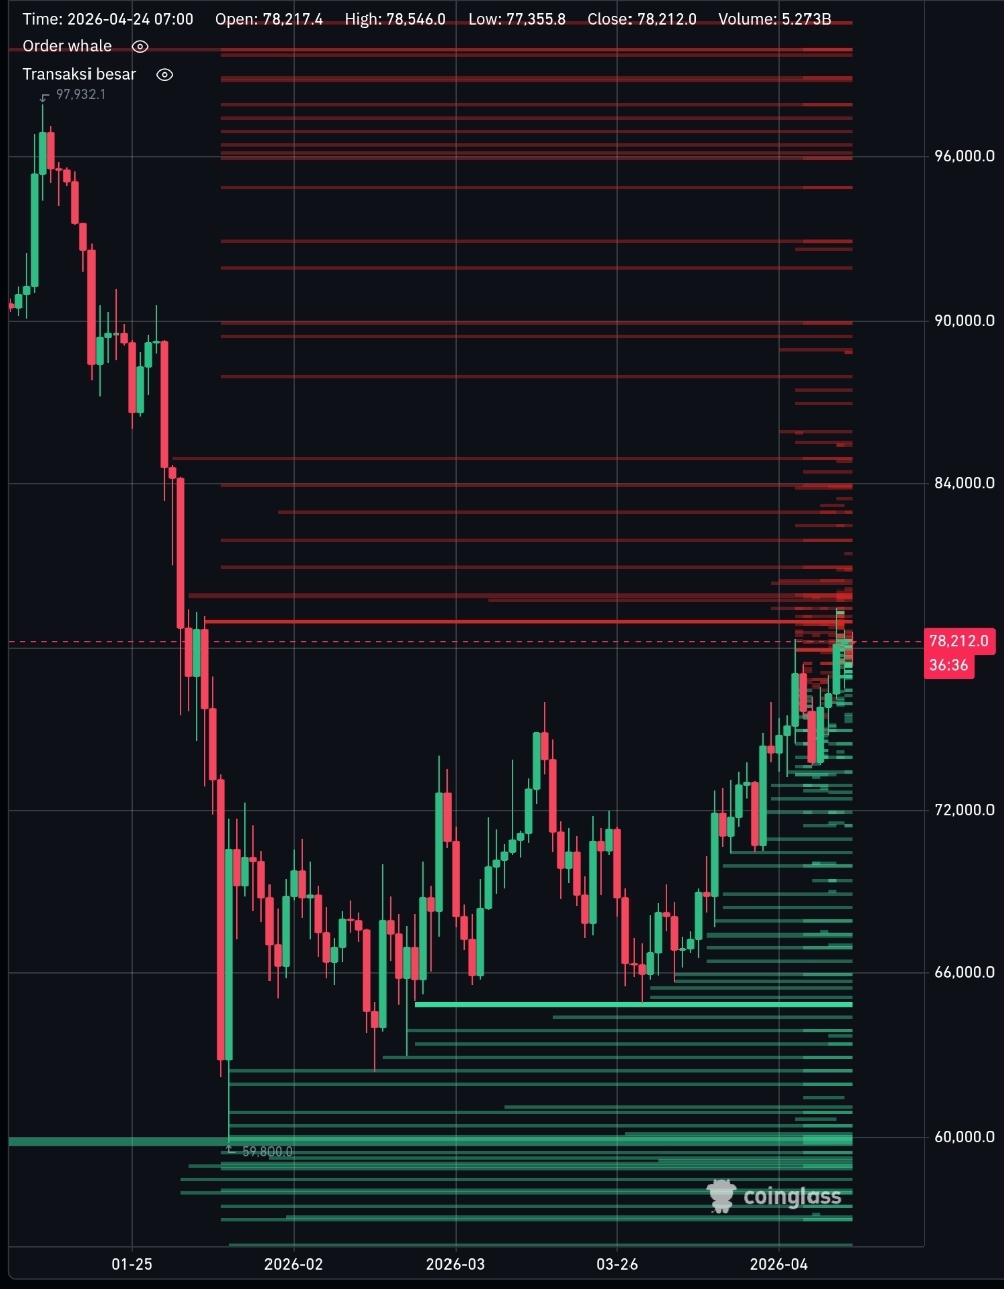
This image displays the order book and liquidation area. The current price is around $78,212. A very strong red wall (resistance) is visible from the $80,000 to $96,000 level. On the downside, there is a fairly dense green liquidity cushion (support) in the $60,000-$66,000 area.
Impact:
Bitcoin is facing a "big wall" at the psychological $80,000 mark. Upward price movement will likely be held back by numerous sell walls or short liquidation targets. If the price is unable to break through this red area in the near term, there is a risk of a retest to the green area below to capture liquidity before continuing to rise.
3. Perpetual Futures vs. Spot Volume Ratio
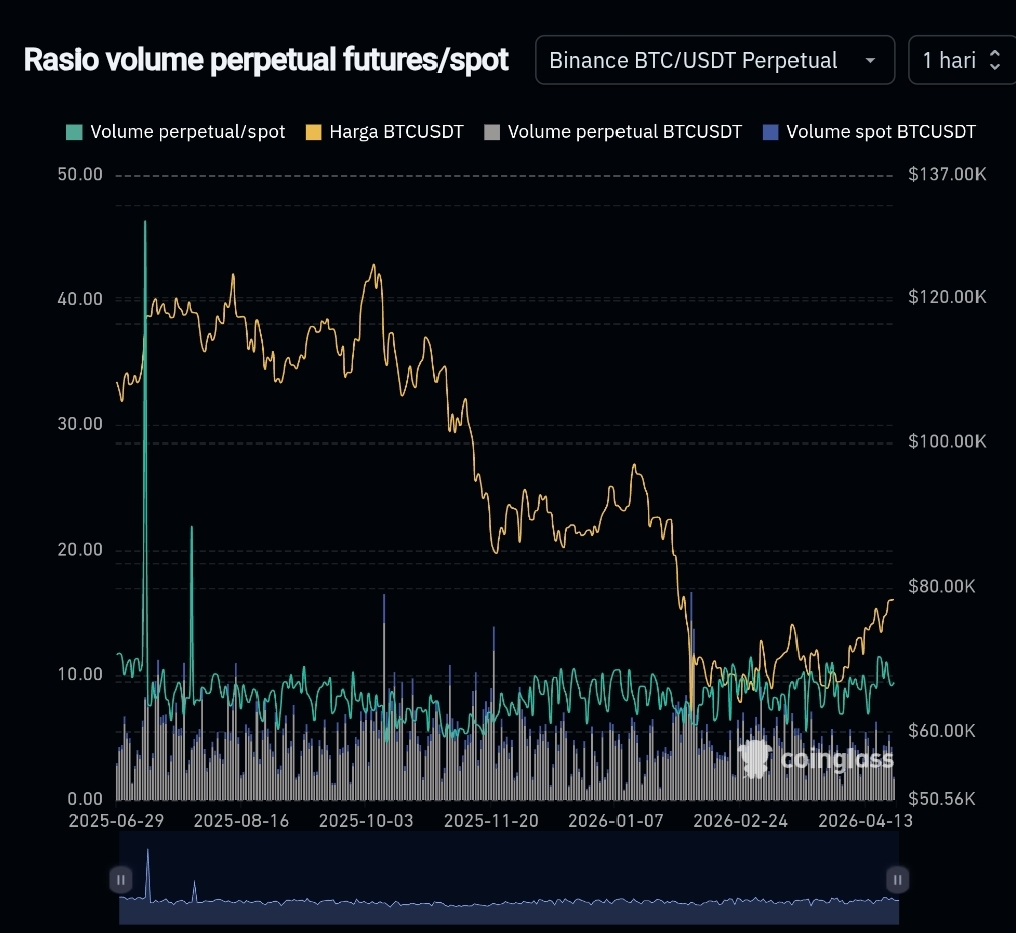
This chart compares futures trading volume with spot trading. The yellow line (price) shows a recovery trend, while the green line (ratio) remains relatively stable at lower levels compared to the spike in mid-2025.
Impact:
This stable, relatively low ratio is actually healthy. It indicates that the current price increase is driven more by accumulation in the spot market (purchases of the original asset) than simply leveraged speculation in the futures market. Spot-driven markets typically have stronger foundations and are less susceptible to sudden long squeezes.
4. Bitcoin Wallet Inflows/Outflows (Exchange Flows)
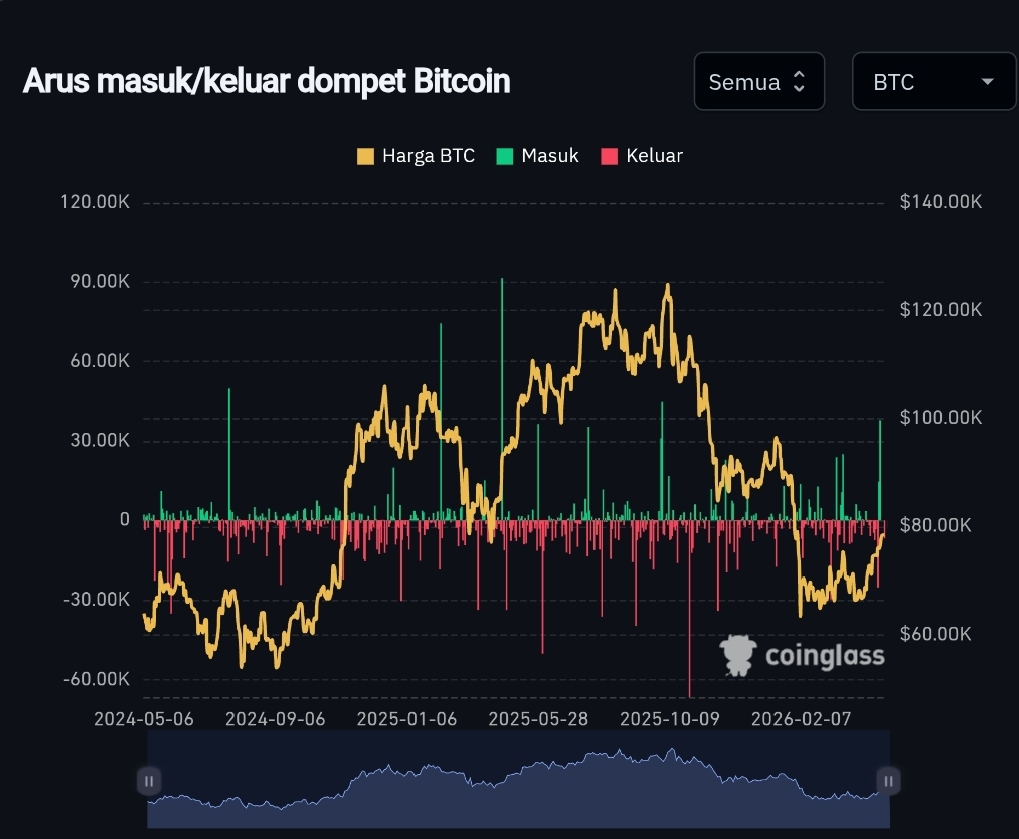
The inflows (green) and outflows (red) from exchanges. As seen at the end of the chart (April 2026), there is a significant spike in green bars entering exchanges, accompanied by increasing price fluctuations.
Impact:
Spikes in inflows to exchanges are usually considered a warning signal (short-term bearish), as coin holders move their assets to exchanges for sale or margin collateral. If this inflow continues to increase without being matched by a strong outflow, selling pressure in the $80k resistance area (in figure 2) could become very large.
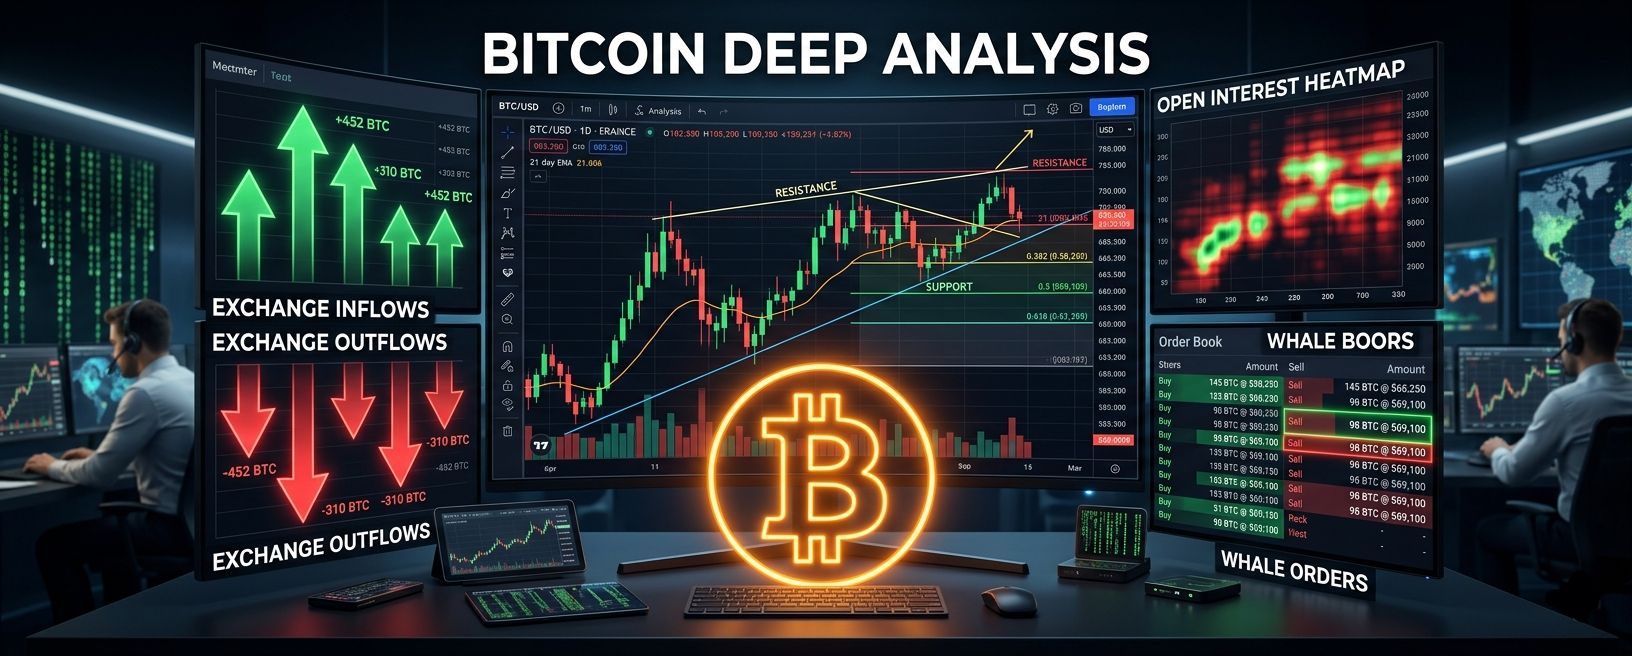
5. Technical Analysis
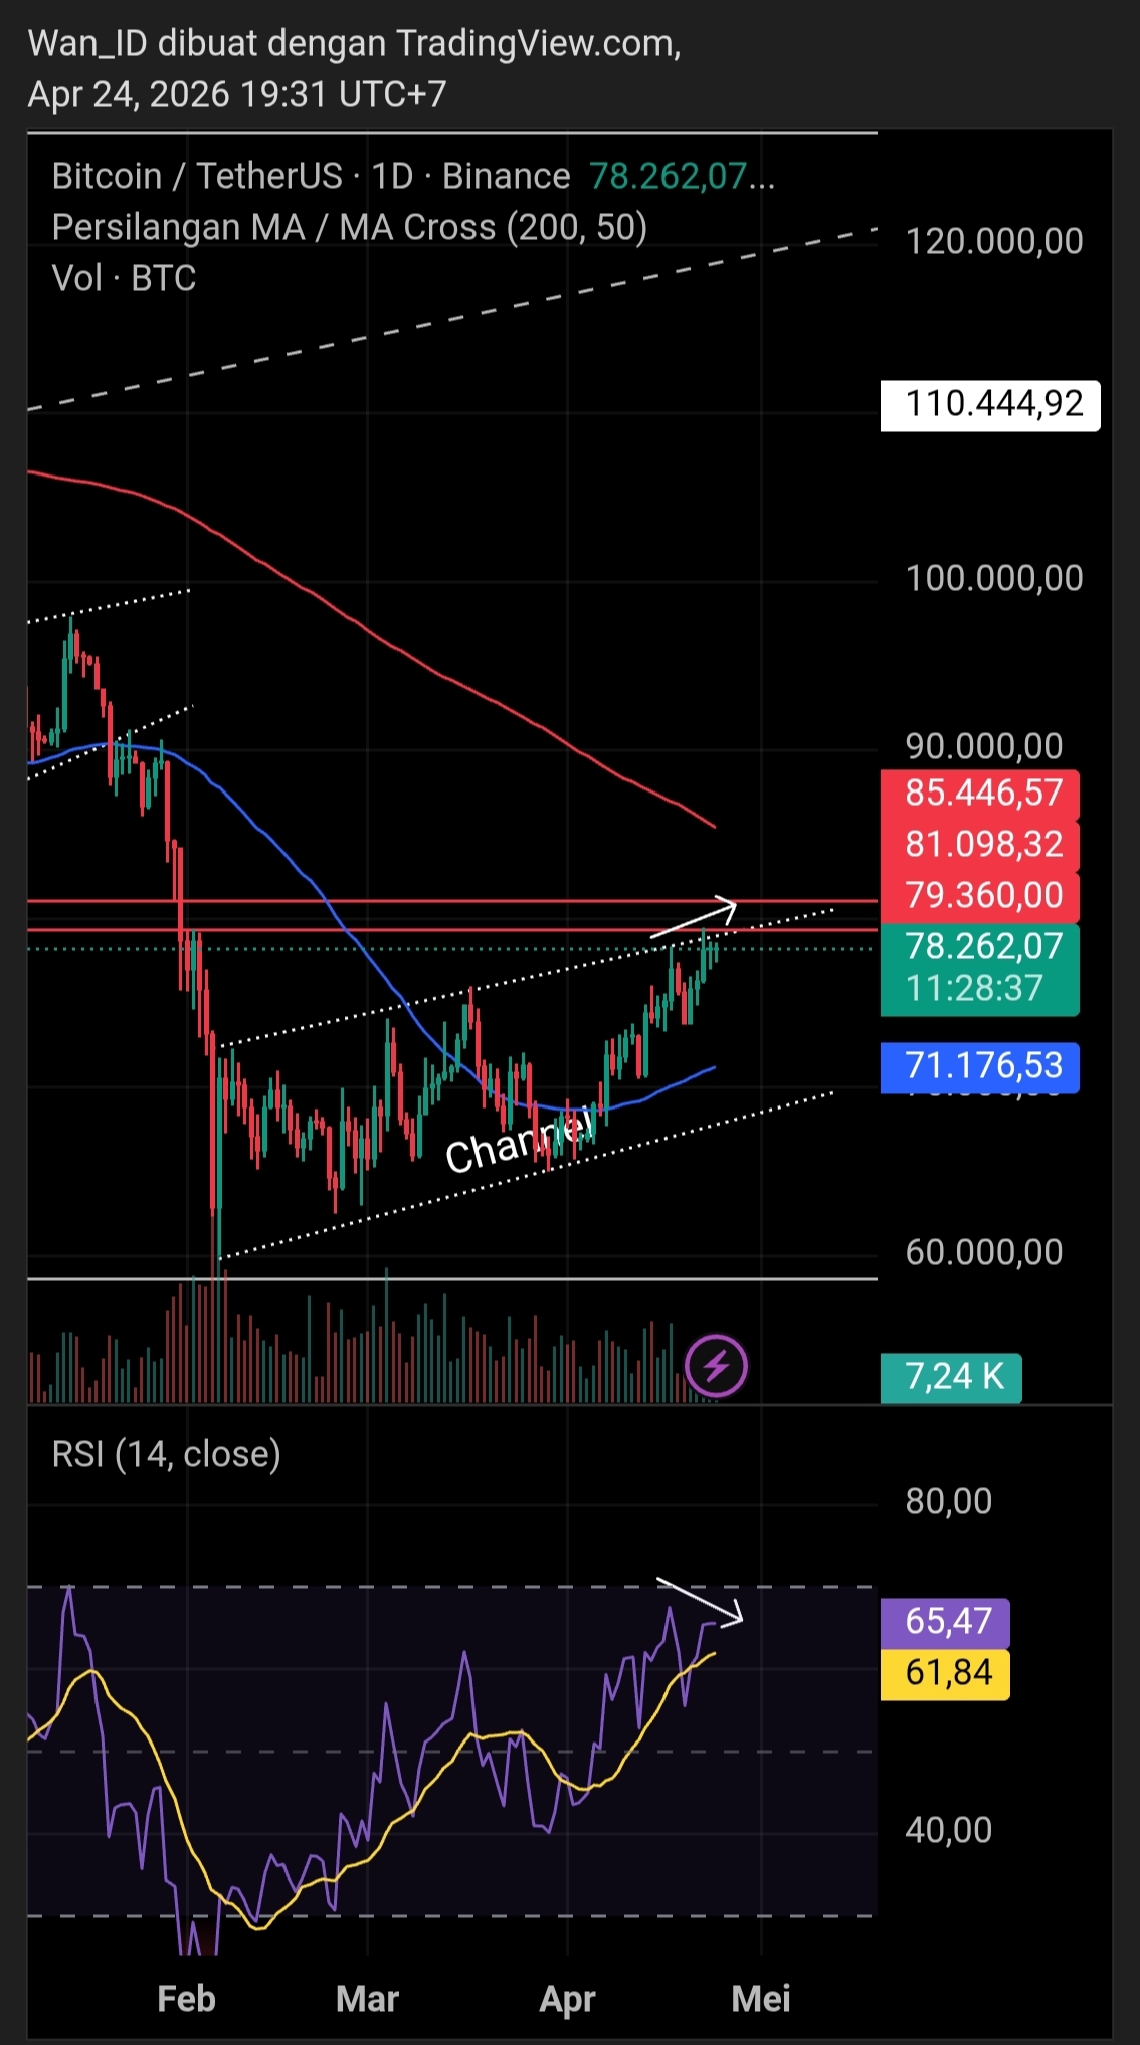
The price is moving steadily bullish in the short term, but there are risks that need to be considered, there is a Bearish Divergence on the chart which indicates weakening buyer volume but the price is still blocked by key resistance, the crucial point is at $79,360 - $81,098, If the price can break through the key resistance with convincing volume and is able to claim the resistance as support, the price can recover further and even become a reversal.
Like and Follow For More Information
$BTC #bitcoin #AaveAnnouncesDeFiUnitedReliefFund #BinanceLaunchesGoldvs.BTCTradingCompetition

